One of the sectors that I like to pay attention to as a barometer for the underlying relative health of the economy is the Materials sector, because the companies that comprise it produce or mine many of the raw materials that make up the building blocks used to create most of the finished goods we use every day. The sector includes industries that cover chemicals and plastics, construction materials, paper, forest, and packaging products, as well as metals and minerals – which means that in some form, this sector touches practically every other segment of the economy in one more or another.
As a reflection of broad economic health, it isn’t that surprising that a lot of the momentum that has helped to drive the sector higher over the past year came on the back of favorable economic indicators as state and global economics began to to reopen, facilitated by aggressive federal stimulus and continued accommodative monetary policy from the Federal Reserve. Vaccine administration has helped to curb infection rates and facilitate reopening of social and business activities that have been severely restricted for more than a year. That supports the view, held since early this year that the second half of 2021 is when most U.S. activity will see a return to some semblance of the “old normal” that existed prior to the pandemic. That is a forecast that bodes well for the entire economy, and so should generally be expected to act as an ongoing tailwind for Materials stocks as well.
Huntsman Corp (HUN) was a good example of the sector’s performance since July of last year – at least until the early part of May. This is a company that has benefitted from a homebuilding industry that has been surprisingly robust over the past year, as residential construction continues to boom in numerous parts of the country. From its bear market low in March at around $12, the stock more than doubled in price by the end of 2020, and even drove to a new high at the start May a little above $32. From that point, however, the stock has dropped back into a clear, short-term downtrend, trimming more than -20% off of its value as of this writing. While the company managed to weather the worst of the pandemic storm through most of last year, the last couple of quarters of 2020 revealed a pattern of declining Free Cash flow and narrowing overall profitability severe enough to shift the value argument significantly against the stock’s upward trend. The last couple of earnings reports indicate that pattern may be stabilizing, which begs the question of whether the stock’s recent decline might be enough to put its current level into bargain territory. Let’s find out!
Fundamental and Value Profile
Huntsman Corporation is a manufacturer of differentiated organic chemical products and of inorganic chemical products. The Company operates all of its businesses through its subsidiary, Huntsman International LLC (Huntsman International). The Company operates through five segments: Polyurethanes, Performance Products, Advanced Materials, Textile Effects, and Pigments and Additives. Its Polyurethanes, Performance Products, Advanced Materials and Textile Effects segments produce differentiated organic chemical products and its Pigments and Additives segment produces inorganic chemical products. The Company’s products are used in a range of applications, including those in the adhesives, aerospace, automotive, construction products, personal care and hygiene, durable and non-durable consumer products, digital inks, electronics, medical, packaging, paints and coatings, power generation, refining, synthetic fiber, textile chemicals and dye industries. HUN’s current market cap is $5.7 billion.
Earnings and Sales Growth: Over the last twelve months, earnings increased nearly 127.6%, while revenues grew 15.3%. In the last quarter, earnings were 29.4% higher while revenues increased by 10.13%. HUN’s operating profile appears to have reversed its previous decline, however it did narrow in the last quarter. In the last year, Net Income was 6.58% of Revenues, but decreased to 4.52% in the last quarter. It is worth noting that last year, HUN’s quarterly Net Income/Revenue was -4.97%, which can be taken as a strong indication of stabilization and improvement in operating profitability.
Free Cash Flow: HUN’s free cash flow is $100 million. This is marks a decline over the last year, when Free Cash Flow was $375 million, but has also improved from $17, and then $79 million over the last two quarters. The current number translates to a Free Cash Flow Yield of 1.45%. It is also noteworthy that HUN’s Free Cash Flow saw a peak at $1.2 billion in June 2018, and has declined steadily from that point; it helps to put the last year’s decline into perspective and, along with the company’s narrow margin profile should add to the cautious outlook moving into the rest of the year.
Debt to Equity: HUN has a debt/equity ratio of .40. This is a conservative number that has also decreased since the beginning of 2020 from .77. HUN’s balance sheet has also seen declines over the last year but generally remains healthy, as total cash in the last quarter was about $673 million, while long-term debt is $1.5 billion.
Dividend: HUN pays an annual dividend of $.75 per share, which translates to an annual yield that of about 2.42% at the stock’s current price. It is also worth noting that management increased the dividend in the last quarter, from $.65 per share.
Price/Book Ratio: there are a lot of ways to measure how much a stock should be worth; but I like to work with a combination of Price/Book and Price/Cash Flow analysis. Together, these measurements provide a long-term, fair value target at around $24 per share. That means that even with the stock’s recent decline, the stock remains overvalued, with about -7% upside from its current price, and a useful bargain price at around $19.
Technical Profile
Here’s a look at the stock’s latest technical chart.
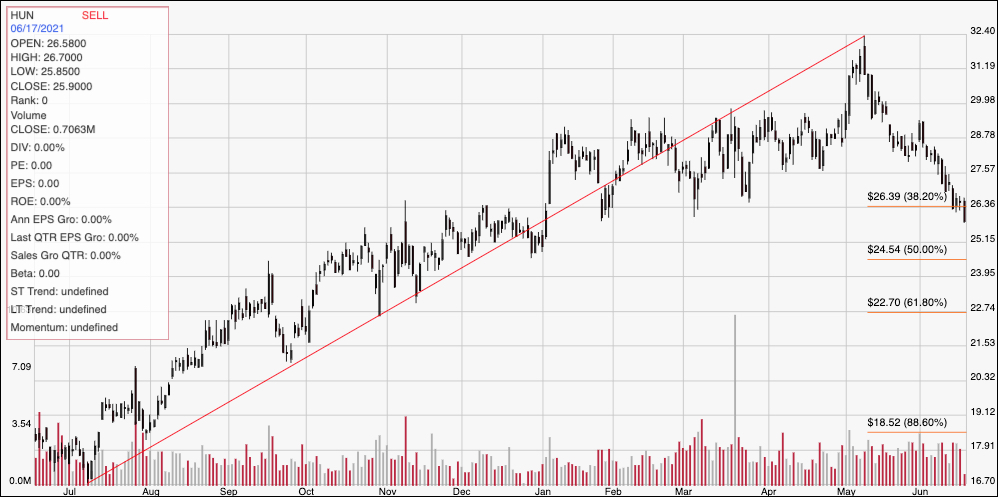
Current Price Action/Trends and Pivots: The diagonal red line on the chart above traces the stock’s upward trend over the past year from a low at around $14 to its high point around $32 in May. It also provides the baseline for the Fibonacci retracement lines shown on the right side of the chart. The stock’s upward trend was been impressive, but the stock’s decline from that point appears to be accelerating since the start of June, with the stock currently dropping below $26 where the 38.2% retracement line rest. That is a violation of support that suggest the stock could continue to fall to around $24.50, where the 50% retracement line would be expected to provide most likely next support. That also puts immediate resistance at $26.
Near-term Keys: HUN’s current momentum is strongly bearish, which means that if you prefer to focus on short-term trading strategies, a bullish trade right now is extremely aggressive and speculative. The current drop below support at $26, on the other hand could be offering an interesting signal to think about shorting the stock or buying put options, with an eye on next support between $24.50 and $23 (where the 61.8% retracement line sits) offering reasonable bearish profit targets. I don’t think there is any way to paint HUN as a good value bet right now; but the stock’s current momentum could start to push the price into bargain territory in the near future. For now, the smart thing to do if you are long-term, value-focused investor is to put HUN aside and come back to it in a month or so to see if the picture has started to change.