The longer you invest in the stock market, the more familiar you become with a lot of the concepts that are used to define and justify the various investing methods that drive them. Years ago, as I began to incorporate technical analysis and shorter-term trading strategies into my system, one of the simplest technical patterns I learned to recognize was a short-term pullback within a longer upward trend. This is a pattern that has a couple of different terms, like “flag” and “pennant” among market technicians, but I learned to associate it in a different way.
Sometimes visuals provide a better frame of reference for putting concepts in their proper context. Stocks in upward trends often form a pattern not very dissimilar from the profile look of a staircase, with each successive high punctuated by periodic pauses in the rise, or even in a shorter-term drop in price. Another common reference for the pattern is “ABC Pattern,” using each letter to identify short-term pivot highs and lows within a longer trend.
Westrock Company (WRK) is a stock that appears to be setting up exactly the kind of pullback pattern within an upward trend that usually signals a good opportunity for short-term, momentum-focused traders. After forming an intermediate upward trend from last July to mid-May that saw the stock more than double in price, the stock has dropped back a little over -16% before pivoting and moving back higher over the last six weeks. When you factor additional technical concepts like Fibonacci trends in the analytical view, the stock is nearing an area that may be expected to act as strong support for the longer-term trend. Following its latest earnings announcement, the stock also boasts an improving fundamental profile. What about its value proposition? A -16% decline is interesting to a contrarian, value-oriented investor, but is it enough to also provide the basis for a good long-term opportunity? Let’s dig in.
Fundamental and Value Profile
WestRock Company, incorporated on March 6, 2015, is a multinational provider of paper and packaging solutions for consumer and corrugated packaging markets. The Company also develops real estate in the Charleston, South Carolina region. The Company’s segments include Corrugated Packaging, Consumer Packaging, and Land and Development. The Corrugated Packaging segment consists of its containerboard mill and corrugated packaging operations, as well as its recycling operations. The Consumer Packaging segment consists of consumer mills, folding carton, beverage, merchandising displays, and partition operations. The Land and Development segment is engaged in the development and sale of real estate primarily in Charleston, South Carolina. WRK has a current market cap of $13.9 billion.
Earnings and Sales Growth: Over the past year, earnings declined -19.4%, while sales declined -0.21%. In the last quarter, earnings dropped by -11.5%, while sales were flat but positive, at 0.82%. Over the past year, WRK’s operating profile dipped into negative territory, reflected by the fact that Net income as a percentage of Revenues was 04.06% over the last twelve months. Given the difficulties every sector has dealt with during the pandemic, that isn’t particularly surprising, but the good news is that the number swung back to positive territory in the last quarter, at 2.54%. WRK has historically operated with a very narrow margin profile; even so, this is a metric that is worth paying attention to in the quarters ahead to verify or refute the idea that the company has turned the corner on a broadly difficult economic period.
Free Cash Flow: WRK’s Free Cash Flow is healthy, at $1.675 billion, and which translates to an attractive Free Cash Flow Yield of 11.81%. It also marks a significant improvement over the last year, when Free Cash Flow was $1.03 billion. Growth in this metric offers a useful counterpoint to the difficult operating profile I just mentioned using Net Income.
Debt to Equity: WRK has a debt/equity ratio of .76, which is pretty conservative. The company doesn’t have great liquidity, with cash and liquid assets of a little over $334 million in the last quarter versus long-term debt of about $8.4 billion; however it should be noted that cash has increased from $251 million a year ago and $151.6 at the beginning of 2020.
Dividend: WRK pays an annual dividend of $.96 per share, which at its current price translates to a very attractive dividend yield of about 1.84%.
Price/Book Ratio: there are a lot of ways to measure how much a stock should be worth; but I like to work with a combination of Price/Book and Price/Cash Flow analysis. Together, these measurements provide a long-term, fair value target a little above $57 per share. That suggests that WRK is undervalued by about 12% from its current price, and a very useful bargain price at around $46.
Technical Profile
Here’s a look at the stock’s latest technical chart.
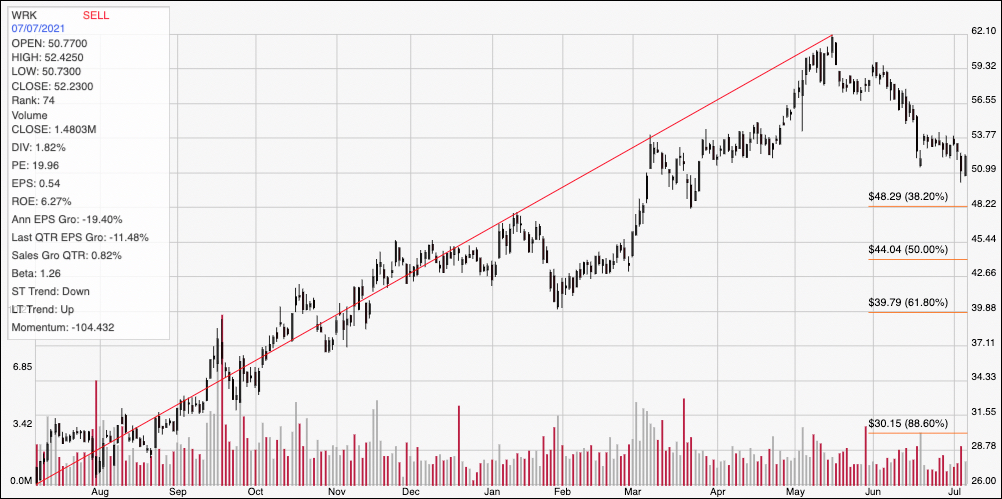
Current Price Action/Trends and Pivots: The chart above displays the last year of price activity for WRK. The diagonal red line marks the stock’s upward trend from July 2020 to mid-May, with the peak at around $62. It also provides the baseline for the Fibonacci retracement lines shown on the right side of the chart. From that peak the stock has slid steadily back into the start of this month, and is nearing expected support at around $48 where the 38.2% retracement line rests. Immediate resistance right now is around $52 based on pivot activity in April. The stock’s current momentum is strongly bearish, signaling that the stock is more likely to test current support than it is to reverse and push above resistance at this stage. A drop below $48 has additional downside to about $44 in the short-term, while the stock would actually need to push above $54 to significantly reverse its downward short-term trend.
Near-term Keys: The stock’s current bearish momentum actually makes any kind of bullish short-term trade very aggressive right now. If the stock can find support anywhere between its current price and $48, however, there could be an interesting opportunity to buy the stock or work with call options using $52 to $54 as useful profit targets. A drop below $48 would be a strong signal to consider shorting the stock or buying put options, with $44 providing a practical exit target on a bearish trade. The stock’s value proposition is interesting at its current level, but given the current bearish momentum, a smart value investor should wait to see the stock find a new, lower consolidation level before looking for a practical entry point for a long-term investment.