Through most of the pandemic, one of the hardest-hit sectors in the market was the Energy sector. Global restrictions on social gatherings and shelter-in-place orders meant that demand for crude oil products collapsed to practically nothing. The story for 2021 has shifted, of course, as vaccinations led to dropping infections and hospitalizations that have allowed many of those restricted activities to resume and businesses to resume some form of “normal” operations. One of the economic pockets that has specifically seen a big increase in activity is the Travel industry, where airlines, for example have reported sizable boosts in demand that, while still not up to pre-pandemic levels, are providing encouraging signs for the Energy sector.
Increasing demand for crude has pushed big increases in price for the commodity; from a starting point below $50 per barrel in January, for example West Texas Intermediate (WTI) crude is now sitting at around $75 per barrel. The increase is generally also being seen at the pump – which is generally good news for stocks in the Energy sector. One of the possible exceptions, however applies to oil refiners, who have the difficult role of trying to find a balance between cost-efficiency in crude and passing through increases downstream through the energy supply chain. Increased prices of the raw commodity generally make that task more difficult and weigh on the profitability of refiners, including the largest, industry leaders.
Phillips 66 (PSX) is one of the largest refiners in the United States, and that came into 2020 in better position than most other companies in its industry. While oil refining is its primary business, it also had the foresight to position itself before the downturn, diversifying into crude storage and shale pipeline projects to alleviate congestion in the Permian Basin and Eagle Ford areas, where a large amount of U.S. shale has been held up by pipeline limitations. They were also aided by an increase in consumer demand in its chemicals business, including packaging for cleaning products. Those are areas that helped to minimize, while not entirely offset the near-term effect of cratered refined crude demand in 2020. After finally finding a bottom in November of last year at around $43, the stock rallied into an extended upward trend that peaked in June at around $94.50 per share. The stock has dropped back from that point by about -13%. Against the backdrop of the longer trend, the stock’s short-term pullback could be setting up an interesting “buy the dip” kind of opportunity for bullish investors – but the risk is that if the drop is being driven by indications that rising crude costs are cutting into the company’s profitability, this could actually be providing an early warning sign of a trend reversal. Let’s dive into the numbers and try to find out what is going on.
Fundamental and Value Profile
Phillips 66 is an energy manufacturing and logistics company with midstream, chemicals, refining, and marketing and specialties businesses. The Company operates through four segments: Midstream, Chemicals, Refining, and Marketing and Specialties (M&S). The Midstream segment gathers, processes, transports and markets natural gas, and transports, stores, fractionates and markets natural gas liquids (NGLs) in the United States. The Chemicals segment consists of its equity investment in Chevron Phillips Chemical Company LLC (CPChem), which manufactures and markets petrochemicals and plastics. The Refining segment buys, sells and refines crude oil and other feedstocks at refineries in the United States and Europe. The M&S segment purchases for resale and markets refined petroleum products, such as gasolines, distillates and aviation fuels, primarily in the United States and Europe, as well as includes the manufacturing and marketing of specialty products, and power generation operations. PSX’s current market cap is $35.4 billion.
Earnings and Sales Growth: Over the last twelve months, earnings declined by almost -214% (not a typo), while sales increased 3.22%. In the last quarter, earnings were exactly flat, at 0.00% while sales were almost 31% higher. That unimpressive earnings pattern can also be seen in PSX’s margin profile, which is normally quite narrow but has remained in negative territory for the past year. Over the last twelve months, Net Income was -3.45% of Revenues, and increased only slightly to -3.02% in the last quarter.
Free Cash Flow: PSX’s free cash flow was -$163 million for the trailing twelve month period. This measurement confirms the negative picture I just drew using Net Income, but may be showing signs to recovery, as Free Cash flow was around -$809 million in the quarter prior, -526 billion six months ago, and $330 million a year ago.
Debt to Equity: PSX has a debt/equity ratio of .73, a generally conservative number that indicates the company operates with a conservative philosophy about leverage. Their balance sheet shows $1.3 billion in cash and liquid assets versus $14.9 billion in long-term debt. It is worth noting that at the end of 2020, long-term debt was a little over $12 billion while cash was around $1.7 billion.
Dividend: PSX pays an annual dividend of $3.60 per share, which translates to a yield of 4.41% at the stock’s current price. While management has maintained the dividend throughout the pandemic’s challenges, the declining state of Free Cash Flow, Net Income and liquid assets means that the sustainability of the dividend is an open, unanswered question.
Price/Book Ratio: there are a lot of ways to measure how much a stock should be worth; but I like to work with a combination of Price/Book and Price/Cash Flow analysis. Together, these measurements provide a long-term, fair value target around $52 per share. That suggests that PSX is significantly overvalued, by about -36% at the stock’s current price.
Technical Profile
Here’s a look at the stock’s latest technical chart.
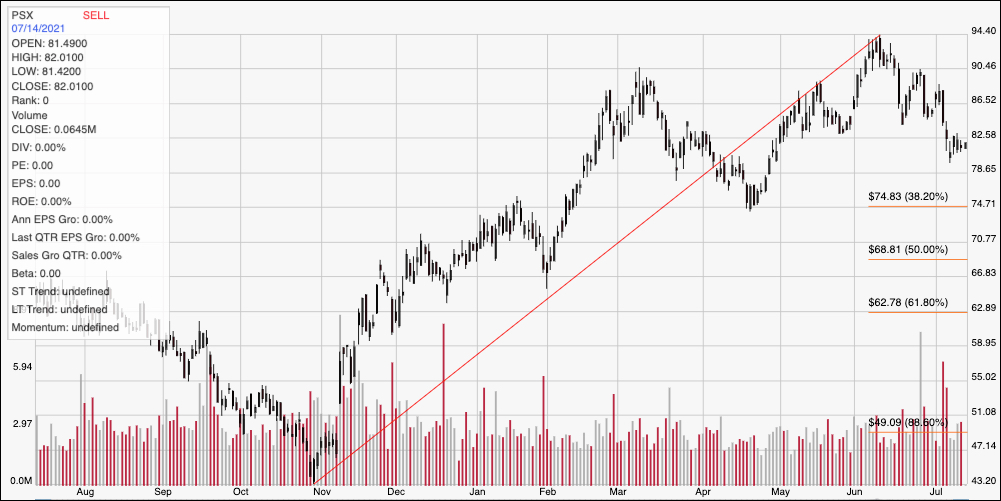
Current Price Action/Trends and Pivots: The chart above shows the stock’s price action over the past year. The red diagonal line traces the stock’s upward trend from November 2020 to its peak in June at around $94.50. It also provides the baseline for the Fibonacci retracement lines on the right side of the chart. From that peak, the stock has dropped back and appears to have found support at around $80 per share, with immediate resistance at around $83. A drop below $80 has additional downside to about $75, where the 38.2% retracement line should offer next support, while a push above $83 should find next resistance at around $90.
Near-term Keys: Given the relatively grim fundamental picture that I think accurately reflects the challenges PSX has been dealing with for the past year and a half, it isn’t hard to understand the stock’s overvalued status. I also think that means that the stock’s current decline is a sign of increasing bullish risk. If you prefer to work with short-term trading strategies, you could use a drop below $80 as a strong signal to consider shorting the stock or working with put options, with $75 acting as a very attractive initial bearish profit target. I think looking for a bullish short-term trade right now is pretty speculative, but if the stock pushes above $83, you could think about buying the stock or working with call options, with a possible target price at around $90 providing an attractive exit point.