In the Technology sector, one of the most interesting trends to follow for the past few years has come from streaming media. Services like Netflix, Amazon Prime and Hulu were the early entrants into this fast-growing segment that has since seen a number of major broadcasting companies see the light and jump into the fray with services of their own. That is part of the reason that in the last couple of years, the broadcasting industry has also seen a lot of consolidation via mergers and acquisitions. The acquisition in 2018 of Time Warner by AT&T (T), for example prompted the Walt Disney Co. (DIS) to jump into, and win a bidding war with Comcast Corporation (CMSCA) over coveted assets from 21st Century Fox. While the Time Warner acquisition hasn’t worked out as planned for AT&T – who have since announced plans to spin WarnerMedia into a separate company – Disney’s acquisition of the majority of 21st Century Fox’s entertainment assets only helped to broaden the already massive library it could offer to subscribers for its Disney+ streaming service.
Drawing less attention in the aftermath of all of that M&A activity is Fox Corp (FOX), the independent company that began trading publicly in 2019 and retained the Fox Broadcasting Company, Fox Television Stations, Fox News Media, and Fox Sports in the U.S. The new organization was leaner and more focused on news, bringing the company back to the roots that founder and executive chairman Rupert Murdoch preferred to focus on. This is a company with a solid balance sheet that has remained pretty stable, even during the economic turmoil of the past year and a half. The stock enjoyed a sizable run up in price from around $24 in August of last year to a mid-March peak a little above $42. From that point, the stock dropped back sharply into the end of March and began consolidating between April and June between $35 and $36 per share. That pattern held until the end of June, when the stock dropped below $35 and has been picking up bearish momentum since then. For growth-oriented investors, this is the kind of pattern to run away from; but for long-term, value-oriented investors, a stock coming significantly off of a 52-week high is something that generally arouses greater interest. Does the stock’s current decline, along with its solid fundamental profile really just make the stock a useful value you shouldn’t ignore? Let’s find out.
Fundamental and Value Profile
Fox Corporation is a news, sports and entertainment company. The Company operates through three segments: Cable Network Programming, Television and Other, Corporate and Eliminations. The Cable Network Programming segment consists of the production and licensing of news and sports content distributed primarily through cable television systems, direct broadcast satellite operators, telecommunication companies and online video distributors, primarily in the United States. The Company’s Television segment consists of the acquisition, marketing and distribution of broadcast network programming nationally under the FOX brand. Its Other, Corporate and Eliminations segment includes FOX Studios lot, which provides television and film production services along with office space, studio operation services. FOX has a current market cap of $19.2 billion.
Earnings and Sales Growth: Over the last twelve months, earnings declined -5.4%, while sales also moved -6.5% lower. In the last quarter, earnings improved by 450% while Revenues were -21.3% lower. FOX’s Net Income versus Revenue is healthy, at 16.23% over the last twelve months and strengthening to 17.64% in the last quarter.
Free Cash Flow: FOX’s Free Cash Flow is healthy, at about $2.4 billion. That number increased slightly from the quarter prior, when Free Cash Flow was $2.36 billion, but has also grown over the last twelve months, when it was a little over $2 billion. The current number translates to a Free Cash Flow Yield of 12.32%.
Debt to Equity: FOX has a debt/equity ratio of .65, which is conservative and a good reflection of the company’s approach to leverage. Their balance sheet shows about $5.7 billion in cash and liquid assets against about $7.2 billion in long-term debt. Their operating profile and high liquidity are good indications FOX has the financial flexibility to adapt to ongoing changes in the markets in which it operates.
Dividend: FOX pays an annual dividend of $.46 per share, which at its current price translates to a dividend yield of about 1.38%.
Price/Book Ratio: there are a lot of ways to measure how much a stock should be worth; but I like to work with a combination of Price/Book and Price/Cash Flow analysis. Together, these measurements provide a long-term, fair value target at about $45.50 per share. That means that the stock is currently trading at a very useful discount, with 37.4% upside from the stock’s current price.
Technical Profile
Here’s a look at the stock’s latest technical chart.
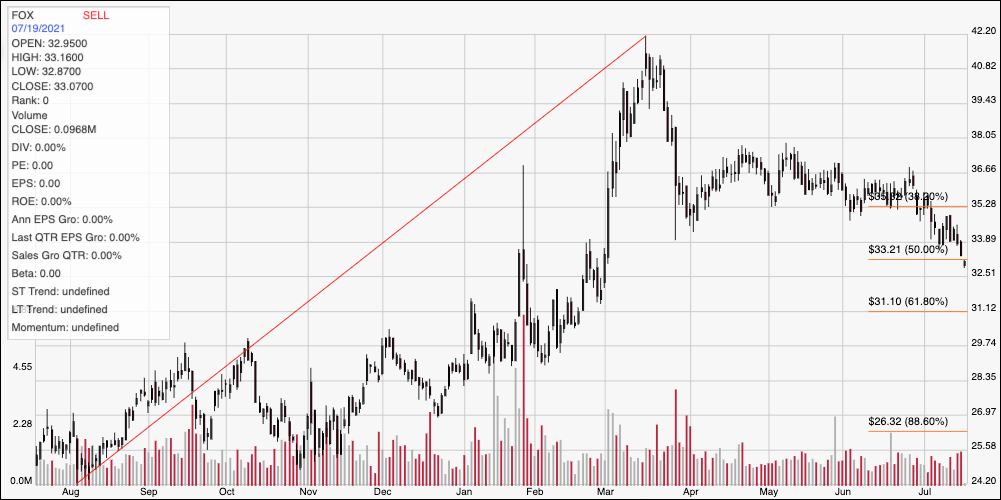
Current Price Action/Trends and Pivots: The chart above covers the last year of price activity; the diagonal red line traces the stock’s upward trend from its August 2020 low around $24 to its March peak above $42. It also provides the baseline for the Fibonacci retracement lines shown on the right side of the chart. From the peak, the stock dropped back to find support at around $35 in late April, and settled into a consolidation range around that support before picking up bearish momentum at the end of June. Current support for the stock looks to be around $31 where the 61.8% retracement line waits, with the stock a couple of dollars above that point right now. Immediate resistance is around $33.50, marked by the 50% retracement line. This was the stock’s most recent support level, with the stock currently falling below that level. A push above $33.50 should have upside to about $35 where the 38.2% retracement line can be seen. If bearish momentum continues and pushes the stock below $31, it could have continued downside to around $28.50 based on pivot activity seen at the beginning of this year.
Near-term Keys: The stock’s fundamentals are solid and provide a useful base to establish the stock’s value proposition, which is very interesting at its current price. The stock’s current momentum could also suggest that, even if you like this stock at its current price, waiting for the stock to find its next stabilization and consolidation range might give you an even better price to work with. If you prefer to work with shorter-term trading strategies, you could use a break above the stock’s immediate resistance around $33.50 as a signal to buy the stock or work with call options, with a near-term exit target at around $35. The stock’s current break below support, with about $2 of room to first support could also be a good signal to think about shorting the stock or to buying put options, using $31 as a good first profit target, and $28.50 if bearish momentum remains strong.