There’s a popular saying that you might have heard in a lot of different settings outside of the stock market: “If it looks like a duck, walks like a duck, and smells like a duck…then it’s a duck.” It’s interesting to me that I haven’t heard or seen the saying used when talking about stocks, given how often I’ve heard it throughout my life in common, everyday settings. The more time I spend paying attention to the market, though, the more I think there’s a reason for that. The truth about stocks – and, quite frankly, one of the things that makes most people simply toss their hands in the air when it comes to active investing – is that very often, the reality about a stock, or the underlying company, is quite different than the perception.
One of the dangers of value investing is that sometimes you’ll start paying attention to a stock that looks, at least at first blush, like it could be a good bargain. It might be a very well-known and respected company, and so sometimes when people realize the stock has dropped off of recent highs, they’ll automatically assume it’s a great opportunity to buy the stock cheap. This kind of situation is often called a value trap, meaning that it looks good enough to get you interested, and perhaps even to go ahead and put your hard-earned capital into it. The trap is that sometimes there are very good reasons the stock has been dropping – and the risk is that it could go even lower.
My own investing style can put me at risk of running into these kinds of value traps. To be clear, the risks I’m talking about aren’t just about the fact the stock might already be in a long, sustained downward trend, or even that a stock may be in the process of reversing a long-term upward trend to the bearish side; they often aren’t readily visible unless you’re willing to open the hood and really start probing around the guts of the business. That means analyzing a lot of the company’s fundamentals and being able to accept when you see a significant amount of problematic data that can act as an early warning that there is more trouble ahead.
I believe MetLife, Inc. (MET) is a pretty good example of what I’m talking about right now. The company has great public visibility and presence, and a strong, long-standing position of leadership in the Life & Health Insurance industry. This is a stock that nearly doubled in price from September 2020 to early in May, rising from about $35 to nearly $68 per share. From that point, the stock has faded back to find a recent low point at around $55 – which might be enough to make strictly value-oriented investors start to take notice. There are also some indications of good fundamentals in place, and some basic valuation measurements like the Price/Earnings and Price/Book ratios that look attractive at first glance. If you dig a little deeper, though, you’ll find that there are also some things to be concerned about, and that should give investors ample reason to think twice before buying the stock.
Fundamental and Value Profile
MetLife, Inc. is a provider of life insurance, annuities, employee benefits and asset management. The Company’s segments include U.S.; Asia; Latin America; Europe, the Middle East and Africa (EMEA); MetLife Holdings, and Corporate & Other. Its U.S. segment is organized into Group Benefits, Retirement and Income Solutions and Property & Casualty businesses. Its Asia segment offers products, including life insurance; accident and health insurance, and retirement and savings products. Latin America offers products, including life insurance, and retirement and savings products. Life insurance includes universal, variable and term life products. EMEA offers products, including life insurance, accident and health insurance, retirement and savings products, and credit insurance. MET has a current market cap of about $51.6 billion.
Earnings and Sales Growth: Over the last twelve months, earnings have increased a little over 39%, while revenues declined nearly -15%. In the last quarter, earnings improved by about 8.37% while revenues declined almost -20%. MET operates with a narrow margin profile that, while relatively stable, also doesn’t allow much room for error. In the last twelve months, Net Income as a percentage of Revenues were 2,1%, and strengthened slightly to 2.3% in the last quarter.
Free Cash Flow: MET’s free cash flow is healthy, at almost $11.3 billion. The warning signal about Free Cash Flow is that it has declined from from about $12 billion over the last year. The current number translates to a Free Cash Flow Yield of 21.65%.
Debt to Equity: MET has a debt/equity ratio of .23. This is a very conservative number, and since the company has more than twice the amount of cash (about $37.4 billion) than it does long-term debt (about $15.3 billion) there is no concern about their ability to service, or even to liquidate their debt if necessary.
Dividend: MET’s annual divided is $1.92 per share and translates to a yield of 3.25% at the stock’s current price.
Price/Book Ratio: there are a lot of ways to measure how much a stock should be worth; but I like to work with a combination of Price/Book and Price/Cash Flow analysis. Together, these measurements provide a long-term, fair value target just a little over $45 per share. That means the stock is significantly overvalued, with about -32% downside from the stock’s current price.
Technical Profile
Here’s a look at the stock’s latest technical chart.
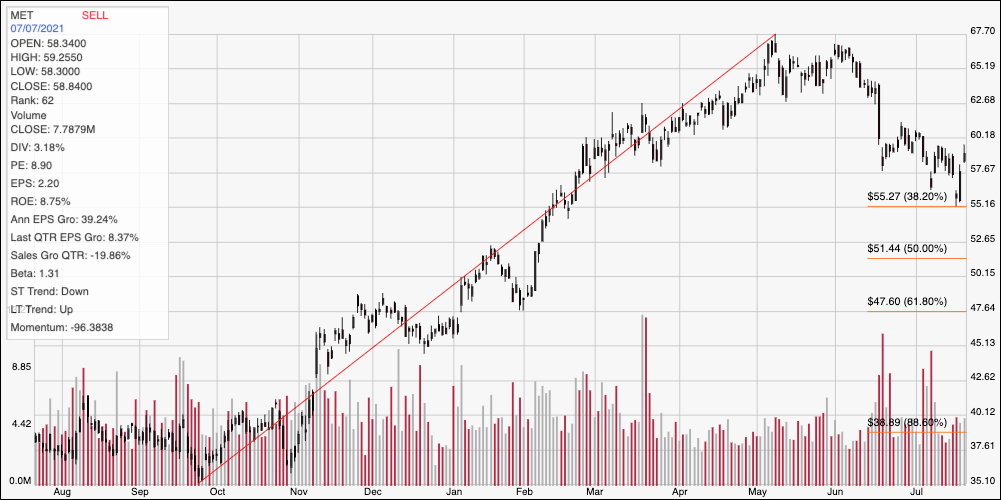
Current Price Action/Trends and Pivots: The red diagonal line measures the length of the stock’s longer-term upward trend from an October 2020 low at around $35 to its May peak at nearly $68; it also informs the Fibonacci trend retracement lines shown on the right side of the chart. From that peak, the stock has moved into an intermediate-term downward trend that appears to have found short-term support around the 38.2% retracement line, at about $55 per share. Immediate resistance is at about $61, with the stock showing some bullish momentum in the last couple of days. A push above $61 could see the stock find next resistance between $63 and $65, while s drop below $55 should find next support around the 50% retracement line, between $52.50 and $51.50.
Near-term Keys: With the stock trading significantly above my fair value target price, there is no way to suggest that MET offers any kind of practical value-based opportunity right now. That means that the best probabilities to work with this stock lie in short-term trades. A push above $61 could be a good signal to think about buying the stock or working with call options, using $65 as a good bullish profit target, while a drop below $55 would be a strong signal to consider shorting the stock or buying put options, with a practical bearish profit target between $52.50 and $51.50 per share.