Among a number of interesting storylines of the past year, is the way corporate America and the markets found ways to adjust and keep pushing forward. It’s true that a big part of the market’s rally can be tied directly to trillions of dollars of economic stimulus, including direct payments to families and individuals that helped dramatically increase savings and investment inflows during the pandemic. I think that was driven, at least in part by the fact that remote workers were limited by shelter-in-place orders from engaging in traditional leisure and social activities. Bored, with a need to do something with their money other than just letting it sit in bank accounts paying practically zero interest, the stock market has offered an easy alternative.
It seems clear that consumers have been anxious for an outlet to more than a year’s worth of pent-up, stay-at-home anxiety, which I think is why there have been pretty significant rebounds over the last few months in social gathering and travel-related economic activity. That’s a positive for industries like travel, hospitality, and the economy at large – but it could also act as a drag on results for the companies that have serviced savings and investment accounts over the past year.
Interactive Brokers Group Inc (IBKR) isn’t one of the most recognizable names in the Financial sector to the average retail investor. This is a company that has built its reputation for most of the past two decades as a discount broker and market maker by appealing to active investors and day traders, and that expanded its business by giving those accounts access to a widening range of electronic exchanges and market centers – for example, stocks, bonds, options, foreign exchange, and futures, all from a single account. That combination of specialization with comprehensive market access is appealing and has helped establish them as an interesting alternative to larger, established names in the Capital Markets industry.
After following the rest of the market off of a bear market low in the first half of 2020 at around $35, the stock more than doubled in price, hitting a peak in early March above $80 per share. From that point, however the stock has dropped into a clear, intermediate downward trend that saw the stock find a five-month low point this week at around $59.50. That pullback is particularly interesting for a value-oriented investor, since the stock’s big drop in price runs counter to a fundamental profile that includes healthy Free Cash Flow, minimal long-term debt and plenty of liquidity. All together this is a stock that I think a smart investor should be paying lots of attention right now. Let’s dive in to the numbers.
Fundamental and Value Profile
Interactive Brokers Group, Inc. (IBG, Inc.) is a holding company. The Company is an automated global electronic broker and market maker specializing in routing orders, and executing and processing trades in securities, futures, foreign exchange instruments, bonds and mutual funds on over 120 electronic exchanges and market centers around the world and offering custody, prime brokerage, securities and margin lending services to customers. It operates in two segments: electronic brokerage and market making. It conducts its electronic brokerage business through its Interactive Brokers (IB) subsidiaries. It conducts its market making business through its Timber Hill (TH) subsidiaries. In the United States, it conducts its business from Greenwich, Connecticut and Chicago, Illinois. Outside the United States, it conducts business in Canada, England, Switzerland, Liechtenstein, China (Hong Kong and Shanghai), India, Australia and Japan. IBKR’s current market cap is about $25.7 billion.
Earnings and Sales Growth: Over the last twelve months, earnings increased by almost 44%, while revenues were a little over 34% higher. In the last quarter, earnings declined by a little over -16%, while sales decreased by almost -12%. The company operates with a healthy margin profile that increased in the last quarter. Over the last twelve months, Net Income during was 10.8% of Revenues, and increased in the last quarter to 12.2%.
Free Cash Flow: IBKR’s free cash flow is $6.5 billion and translates to a Free Cash Flow Yield of 25.45%. It should also be noted that this number dropped from a peak at the end of 2020 at a little over $8 billion, but is still well above the $4.2 billion mark it recorded a year ago.
Dividends: IBKR pays a dividend of $.40 per share, and which translates to annualized yield of 0.65% at the stock’s current price.
Debt to Equity: IBKR has a debt/equity ratio of 0, which isn’t quite true; they did report about $99 million in long-term debt. Their balance sheet indicates that in the last quarter, cash and liquid assets were a little over $48.7 billion. This is an interesting element to think about; the company’s total cash is higher than the stock’s total market cap value.
Price/Book Ratio: there are a lot of ways to measure how much a stock should be worth; but I like to work with a combination of Price/Book and Price/Cash Flow analysis. Together, these measurements provide a long-term, fair value target around $78 per share, which means that IBKR is nicely undervalued, with about 26% upside from its current price.
Technical Profile
Here’s a look at the stock’s latest technical chart.
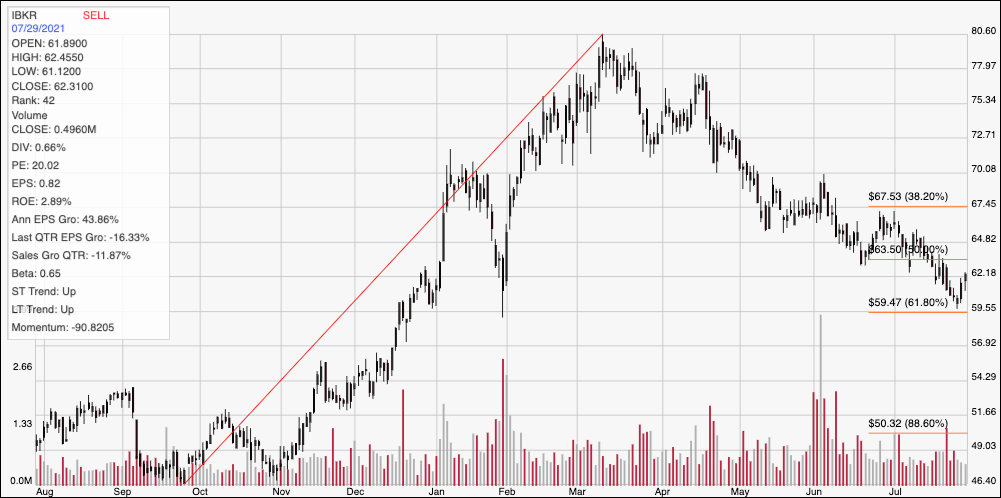
Current Price Action/Trends and Pivots: The chart above traces the stock’s movement over the last year. The diagonal red line traces the stock’s upward trend from its September 2020 low at around $46.50 to its March peak at around $80. It also provides the baseline for the Fibonacci retracement lines shown on the right side of the chart. The stock has dropped into a clear downward trend from that high that includes occasional bounces at temporary support, followed by another push lower. Most recently, the stock used the 61.8% retracement line as latest support at around $59.50 and has been moving higher from that point. Immediate resistance is close by, between $63 and $64. Practically speaking, the stock would need to push above $67.50 to mark a useful reversal of its downward trend; in that case, the stock should have room to rally to around $72 per share. A drop below $59.50, which in all honesty is more likely in the short-term, looks to have additional downside to about $55 per share.
Near-term Keys: IBKR’s value proposition on this stock is compelling, with an impressive amount of fundamental strength driving the stock’s current price. If you’re willing to accept the possibility of some near-term volatility and a continuation of the longer, downward trend, IBKR offers an excellent long-term opportunity. If you prefer to focus on short-term trading strategies, the best probability is on the bearish side, with a drop below $59.50 acting as a useful signal point to consider shorting the stock or buying put options, with an eye on $55 as a near-term profit target. A bullish signal is further away and requires more patience; if the stock can push above $67.50, you can take that move as a good signal to buy the stock outright, or to work with call options, with an attractive profit target in that case at around $72 per share.