If you listen to a lot of “talking head” market analysts on TV, when a popular, well-known stock starts to drop in price, you’ll almost always start hearing about what a great deal the stock is at that price, and how you should “buy the dip” to take advantage of the next swing upward. For a lot of stocks in the market for the last several years, that approach has yielded some big returns because the broad market’s upward trend has been so strong. For a large number of these stocks, however diving into the actual fundamentals and critical measurements of what a company is actually worth provides a very different perspective than what those talking heads would have you believe.
I differ from talking heads, because I’m not trying to get attention with the latest sound bite; more often than not, I think the real objective they have is to keep you watching their programs rather than giving you actual, useful and unbiased information. The easiest way to keep people glued to the television is to talk about the areas of the market that everybody is paying attention to anyway. If there’s one thing that the market has consistently proven over time to hate, it’s change, which means that the longer the talking heads can keep people buying into the status quo, the better off they – and the media that employs them – are going to be.
I’m more interested in being a functional investor than anything else; that also means that when I write about the market, it’s important to me that the things I write about help other people to make better, more educated decisions about the investments they make. You don’t have to agree with me, but if I can give you some extra food for thought, and help you consider the risk versus reward of an investment you’re considering more carefully and effectively, then I’ve accomplished my objective.
Value investing, at its core, is really about trying to identify stocks that are available right now at prices that are significantly lower than what their business is actually worth. Warren Buffet, the Oracle of Omaha and perhaps the most famous living value investor in the world, likes to call value investing “buying a good company at a nice price.” That’s an interesting description, and perhaps that’s why I’ve always thought about value investing like digging through the clearance rack at a department store. You’ll probably pass over the vast majority of items you actually look at, or sometimes not get anything at all; but if you find even one item on that rack you like, you’ll probably feel pretty good about it, because you will have been able to buy it at a much better price than full retail value.
In the retail industry, there is an entire sub-industry built on this same premise. You probably already know about a lot of the stocks that make up this industry, or at least I’m willing to bet that you’ve spent a little bit of time in some of their stores, like TJ Maxx for TJX Companies (TJX), Ross Stores (ROST), and Burlington Coat Factory for Burlington Stores (BURL). TJX in particular is an interesting story as the entire investing world continues to look ahead, past the pandemic and to focus on stocks that should represent good “reopening” opportunities. TJX survived the worst of 2020 better than most companies in the industry, primarily by virtue of its “fortress”-level balance sheet, with cash and liquid assets well above its debt obligations. After hitting a peak in late August above $76, the stock has dropped back by more than -13%. That begs the question of where the stock’s useful bargain price lies in relation to its current value, and whether this is a stock you should include on your watchlist. Let’s take a look at the details.
Fundamental and Value Profile
The TJX Companies, Inc. (TJX) is an off-price apparel and home fashions retailer in the United States and across the world. The Company operates through four segments: Marmaxx, HomeGoods, TJX Canada and TJX International. T.J. Maxx and Marshalls chains in the United States were collectively the off-price retailer in the United States with a total of 2,221 stores, as of January 28, 2017. The HomeGoods chain was an off-price retailer of home fashions in the United States with 579 stores. The TJX Canada segment operates the Winners, HomeSense and Marshalls chains in Canada. Winners is the off-price apparel and home fashions retailer in Canada. HomeSense offers home fashions off-price concept in Canada. The TJX International segment operates the T.K. Maxx and HomeSense chains in Europe. The Company operates approximately 602 T.K. Maxx stores in the United Kingdom, Ireland, Germany, Poland, Austria and the Netherlands. TJX has a current market cap of $80.1 billion.
Earnings and Sales Growth: Over the last twelve months, earnings increased by nearly 539% (not a typo), while sales increased a little over 81%. In the last quarter, earnings rose by 79.55% while sales were 19.73% higher. TJX operates with a narrow margin profile; over the last twelve months, with Net Income that was 6.82% of Revenues, and weakened somewhat in the last quarter to 6.51% of Revenues.
Free Cash Flow: TJX’ free cash flow for the trailing twelve months is healthy, at a little more than $4.6 billion. That translates to a Free Cash Flow Yield of 5.75%. The total number marks a decline from the prior quarter, when Free Cash Flow was $6.7 billion.
Debt to Equity: TJX has a debt/equity ratio of .52. This is a conservative number that reflects a conservative approach to leverage. The company’s balance sheet is a particular source of strength, with $7.1 billion in cash and equivalents against about $3.35 billion in long-term debt.
Dividend: TJX pays an annualized dividend of $1.04 per share, which translates to a yield of 1.56% at the stock’s current price.
Price/Book Ratio: there are a lot of ways to measure how much a stock should be worth; but I like to work with a combination of Price/Book and Price/Cash Flow analysis. Together, these measurements provide a long-term, fair value target at around $69 per share. That suggests that the stock is pretty fairly valued right now, with just 4% upside from its current price, and an especially useful discount price at around $55 per share. It is also worth noting that in the last quarter, this same analysis yielded a fair value target price of $77 per share.
Technical Profile
Here’s a look at the stock’s latest technical chart.
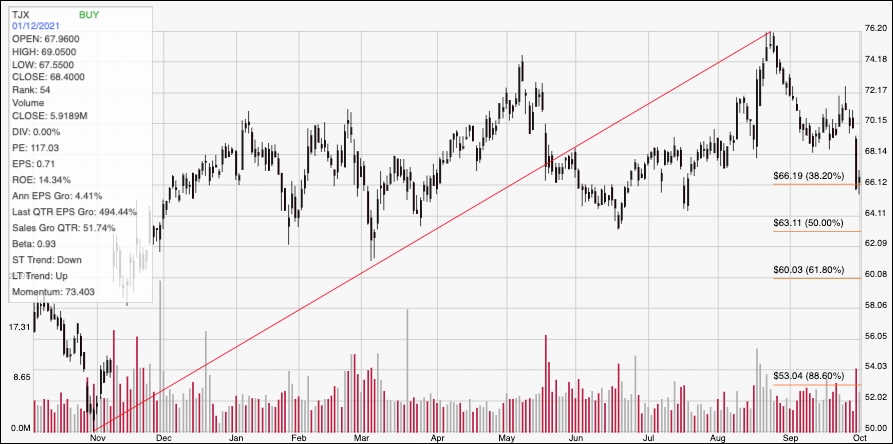
Current Price Action/Trends and Pivots: The red diagonal line traces the stock’s upward trend from a low in November of last year at around $50 to its August peak above $76. It also provides the baseline for the Fibonacci retracement lines shown on the right side of the chart. The stock’s drop from that high was quick into the beginning of September, attempted to stabilize, and then picked up bearish momentum in the last week of the month as the stock fell to current support at the 38.2% retracement line around $66. Immediate resistance is around $68 based on pivot activity in September, August and July in that area. A drop below $66 should find next support somewhere between $64 and $63, where the 50% retracement line sits, while a push above $68 should have near-term upside to about $72 before finding next resistance.
Near-term Keys: TJX’s fundamental strength notwithstanding, the stock’s current drop in price isn’t enough to offer a useful value opportunity at its current level. If you prefer to work with short-term trading strategies, a push above $68 could be a useful signal to think about buying the stock or working with call options, using $72 as useful bullish profit targets. A drop below $66 could also provide an interesting signal to consider shorting the stock or buying put options, looking for a bearish profit target at around $63.