One of the most interesting things to me about the stock market is that there really are as many different ways to invest your money as the human brain can imagine. That’s one of the reasons that there are so many different kinds of mutual fund and ETF choices geared for the average investor. One of the reasons that is so interesting is because it reflects another market reality: everybody has their own opinion about how the market works, and where the best opportunities lie at any given time. Think the market is going to go down? You’ll be able to find a multitude of investment vehicles that are specifically designed to profit when the market drops in value. Think it’s going to go sideways? No problem – there are a bunch of choices you can work with there, too.
I learned a long time ago that there is no such thing as a perfect investing system that is going to work the same way for everybody. What might be really effective for me, for example, might not work at all for the guy down the street from me. The reason why is simple: being different people means that we interpret information and act on it in different ways. It’s also not a given that we are both trying to accomplish the same goal in the investments we make.
I decided a long time ago that relying on fundamental analysis, together with a focus on identifying undervalued stocks, represented the best way for me to make smart choices about the investments that I make. During the high-growth stages of a bull market, that method tends to lag the market, which is one of the reasons it doesn’t get a lot of attention when things are going great. The focus shifts instead to stocks that are doubling or even tripling in value, and just about all the experts on popular media usually want to talk about is why those stocks should keep going up. The strength of the long-term trends of those stocks draws a lot of investors in, because it’s easy to believe that the stock should keep going up, simply because it has been doing it for so long.
Ross Stores, Inc. (ROST) is a really good example of what I mean. If you bought this stock ten years ago and still held it today, you would be looking at incredible gain today. In the midst of the last true bear market in 2008, the stock bottomed at $5.53 per share. If you bought 1,000 shares then – at a cost at the time of $5,530 – as of yesterday’s close, you would be sitting on a small fortune of $108,320. When you hear Jim Cramer talk about home runs, ROST is one of the biggest home runs of the market, with a total gain of nearly 1,860% over the last ten years!
Like the rest of the market, ROST dropped from an all-time high at around $124 in March 2020 to a short-term, technical bear market low at around $56 as pandemic-induced shutdowns and shelter-in-place orders brought the global economy to a standstill. From that point, the stock recovered gradually, eventually reclaiming its pre-pandemic high in March and pushing to a new all-time high a little above $134 in early May.
From that high, the stock has slid back by nearly -20% as concerns about inflation, interest rates and the reality that the health crisis shows no real signs of abating have emerged. ROST is a stock with some terrific fundamentals behind it, and so the question for a value-based investor is whether the stock’s current drop provides an opportunity to start thinking about using it as a useful new long-term investment at a nice price. Let’s check it out so you can decide for yourself.
Fundamental and Value Profile
Ross Stores, Inc. and its subsidiaries operate two brands of off-price retail apparel and home fashion stores-Ross Dress for Less (Ross) and dd’s DISCOUNTS. The Company is the off-price apparel and home fashion chain in the United States, with 1,340 locations in 36 states, the District of Columbia and Guam, as of January 28, 2017. The Company offers in-season, name brand and designer apparel, accessories, footwear, and home fashions for the entire family at savings of 20% to 60% off department and specialty store regular prices every day. The Company also operated 193 dd’s DISCOUNTS stores in 15 states as of January 28, 2017. As of January 28, 2017, the Company operated a total of 1,533 stores consisted of 1,340 Ross stores and 193 dd’s DISCOUNTS stores. As of January 28, 2017, the Company owned and operated six distribution processing facilities-three in California, one in Pennsylvania, and two in South Carolina. ROST’s current market cap is $38.5 billion.
Earnings and Sales Growth: Over the last twelve months, earnings increased almost 1,169.23% (not a typo), while sales growth saw an increase of nearly 79%. The picture has gotten less favorable in the last quarter, where earnings increased 3.73%, while sales increased 6.4%. The company operates with a pretty healthy margin profile; over the last twelve months, Net Income was 7.73% of Revenues, but strengthened to 10.29% in the last quarter.
Free Cash Flow: ROST’s free cash flow is healthy, at more than $3 billion over the last twelve months. This is also a number that has increased steadily for the past several years from just around $400 million in late 2013, and about $1.1 billion in 2018. The current number translates to a Free Cash Flow Yield of 7.82%.
Debt to Equity: ROST has a debt/equity ratio of .63, which is conservative for a company in the Consumer Discretionary space. Their balance sheet also shows cash and liquid assets of more than $5.5 billion versus long-term debt of $2.45 billion. Their excellent liquidity along with healthy operating margins suggests that debt service is no problem.
Dividend: Like a lot of stocks in the Speciality Retail industry, ROST suspended its dividend payout at the onset of the pandemic, but reinstated it at the beginning of the year at a rate of pays an annual dividend of $1.14 per share. That translates to a modest yield of 1.05% at the stock’s current price.
Price/Book Ratio: there are a lot of ways to measure how much a stock should be worth; but I like to work with a combination of Price/Book and Price/Cash Flow analysis. Together, these measurements provide a long-term, fair value target a little above $131 per share. That means ROST is nicely undervalued, with about 21% upside from its current price.
Technical Profile
Here’s a look at the stock’s latest technical chart.
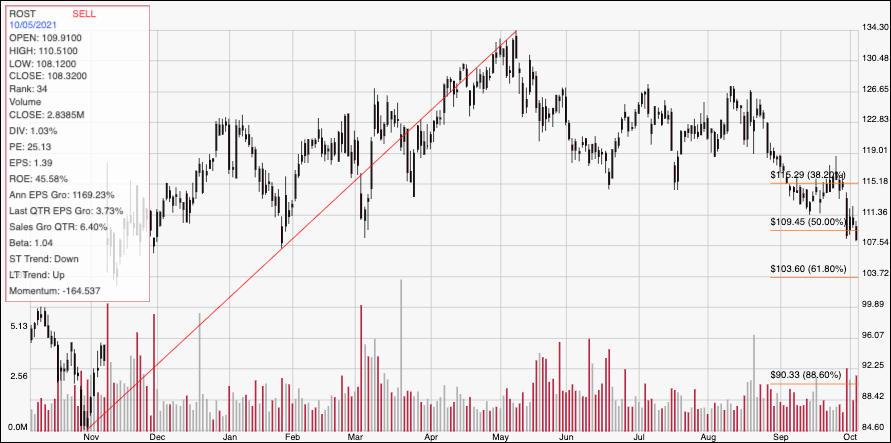
Current Price Action/Trends and Pivots: The chart above displays ROST’s price activity for the past year. The red line traces the stock’s upward trend to its high in May a little above $134 per share and provides the basis for the Fibonacci retracement lines shown on the right side of the chat. The stock downward trend began to accelerate in August, attempted to rally in September but picked up steam again late in the month and into this month as the stock used the 38.2% retracement line for resistance and is currently falling below the 50% retracement line at around $109.50, which now marks immediate resistance. Current support should be at around $103.50, where the 61.8% retracement waits, with additional downside to around $100 if bearish momentum continues to accelerate.
Near-term Keys: The technical picture for this stock is clearly bearish, with momentum to the downside currently increasing and giving any kind of bullish, short-term trade a very low probability of success. While the value proposition is attractive, the stock’s current, increasing bearish momentum suggests that even a long-term investor should wait to see the stock begin to stabilize before looking for a serious entry point. The highest probability opportunity in this stock right now lies in the downside; the stock’s current drop below $109.50 could be a good signal to consider shorting the stock or buying put options, with an immediate profit target at around $103.50, and $100 very possible if selling pressure continues.