Years ago, as I began my career as an investor, I read a book by Peter Lynch. Mr. Lynch had made his name, and his fortune, as the manager of Fidelity’s flagship Magellan fund in the late 70’s and ’80’s, and his incredible performance was one of the big reasons Magellan, at the time, was the largest mutual fund in America, with $14 billion in assets under management. The fund averaged an annual return of more than 29% while under his leadership, making it the top-performing fund in the world.
Shortly before retiring from the fund, Mr. Lynch wrote the book I was reading, One Up on Wall Street, in which he described the method he applied to the Magellan fund. I was surprised to see how he started simple, and much of what I learned from that book still plays a role in what I do today. Lynch popularized the idea of the “local economy,” meaning that often the best investment opportunities can be found not just within your own respective region or part of the world, but even within arm’s reach.
Finding investments at arm’s reach means recognizing the products that you, as a consumer, make use of on a regular, even daily basis. If you’re like me, most of the time, you don’t think about these items very much at all – when I go to the grocery or department store for the week with my wife, we have a list of items that we always need to have on hand, so there are certain parts of the store we always go through. Personal hygiene – shampoo, soap, toothpaste, deodorant, lotion, vitamins – check. Cleaning supplies – laundry soap, dish soap, window cleaner, surface wipes – check. Mr. Lynch helped me realize that the companies behind these products that have become a normal part of my home can also make good investing opportunities.
I like to cast a wide net when I look for value investing opportunities, and that’s why you see me try to write about stocks in just about every sector of the economy. Sometimes my desire to take the broadest approach possible means that I start to forget about what is just within arm’s reach, and so I try to remind myself even so often to come back to those stocks that make the products I already know so much about because I use them all of the time. That’s one of the reasons that today I’m writing about Johnson & Johnson (JNJ).
Johnson & Johnson is categorized as a large-cap pharmaceutical company, and the scope of their brand portfolio means that the odds you use one or more of their products on a regular is very high indeed. Whether you’re thinking about skin lotion, bath soap, adhesive bandages, aspirin or heartburn tablets, it’s a fair bet that you’ll find something made by this company on a shelf in your home. Over the last year and a half, this is also a company that has held its own place in the battle against COVID-19, developing and delivering its own one-shot vaccine. Earlier this month, the FDA also recommended that anyone 18 and over who got JNJ’s vaccine should also receive a booster to reinforce their protection from the virus.
Generalized uncertainty about how long existing vaccines provide proper protection late this summer helped to put a fair amount of bearish pressure on the Pharmaceutical industry. From mid-August until earlier this month, the stock dropped from a 52-week high at around $180 to a short-term low at around $157. In the last couple of weeks, the stock has picked up renewed bullish momentum, rallying as of this writing to a little below $165. The last year has also seen the company’s fundamentals show considerable strength, with a solid balance sheet, improving free cash flow and healthy dividend. Are those elements enough, along with the stock’s drop since August to also make the stock a useful value? Let’s dig in.
Fundamental and Value Profile
Johnson & Johnson is a holding company, which is engaged in the research and development, manufacture and sale of a range of products in the healthcare field. It operates through three segments: Consumer, Pharmaceutical and Medical Devices. Its primary focus is products related to human health and well-being. The Consumer segment includes a range of products used in the baby care, oral care, skin care, over-the-counter pharmaceutical, women’s health and wound care markets. The Pharmaceutical segment is focused on five therapeutic areas, including immunology, infectious diseases, neuroscience, oncology, and cardiovascular and metabolic diseases. The Medical Devices segment includes a range of products used in the orthopedic, surgery, cardiovascular, diabetes care and vision care fields. Its research facilities are located in the United States, Belgium, Brazil, Canada, China, France, Germany, India, Israel, Japan, the Netherlands, Singapore, Switzerland and the United Kingdom. JNJ’s current market cap is $432.5 billion.
Earnings and Sales Growth: Over the last twelve months, earnings increased a little over 18%, while sales increased 10.7%. In the last quarter, earnings increased by 4.84% while sales growth was flat, but positive at 0.11%. JNJ is a company with a healthy margin profile that has nonetheless been challenged, and is showing signs of deterioration. In the last quarter, Net Income as a percentage of Revenues was 19.55% versus 15.71% in the last twelve months.
Free Cash Flow: JNJ’s free cash flow is strong, at $23.4 billion. This is also a number that has increased steadily since the fourth quarter of 2016, and translates to a free cash flow yield of 5.37%.
Debt to Equity: JNJ has a debt/equity ratio of .44. This is a conservative number that generally suggests the company follows a conservative approach to leverage and debt management. Their balance sheet shows cash and liquid assets of $25.3 billion against long-term debt of $30.3 billion. Their operating profile suggests that JNJ should have no problem servicing their debt, with good liquidity as well.
Dividend: JNJ pays an annual dividend of $4.24 per share, which translates to a yield of about 2.59% at the stock’s current price. It is also worth noting that in late 2019, JNJ’s dividend was $3.80 per share. The increase from that point is another useful sign of strength.
Price/Book Ratio: there are a lot of ways to measure how much a stock should be worth; but I like to worth with a combination of Price/Book and Price/Cash Flow analysis. Together, these measurements provide a long-term target at about $144 per share. That suggests that the stock is overvalued by about -12% right now, with a practical discount price at around $115.
Technical Profile
Here’s a look at the stock’s latest technical chart.
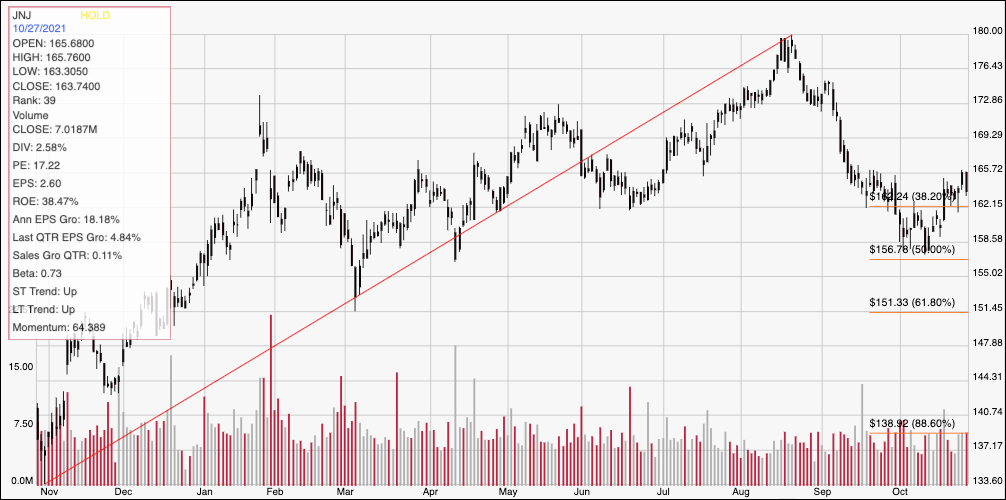
Current Price Action/Trends and Pivots: The diagonal red line traces the stock’s upward trend from November of last year to its August peak at $180; it also provides the baseline for calculating the Fibonacci retracement levels indicated by the horizontal red lines on the right side of the chart. From its $180 peak, the stock dropped back to finally find trend support earlier this month at around $157 per share, which is also inline with the 50% retracement line. That level provided strong support, allowing the stock to rally in the last week or so above expected resistance at $162 where the 38.2% retracement line can be seen, and which now marks current support. Immediate resistance is at $165. A push above $165 should give the stock room to rally to about $169 per share before hitting next resistance, while a drop below $162 could see downside to the stock’s recent pivot low at around $157.
Near-term Keys: For a value investor, JNJ unfortunately doesn’t offer any kind of useful value at its current price. That means that the best probabilities lie in short-term trading strategies. Use a push above $165 to think about buying the stock or working with call options, with $169 marking a pretty useful short-term, bullish profit target. A drop below $162 would be a good signal to consider shorting the stock or buying put options, with the stock’s last pivot at around $157 acting as a practical profit target on a bearish trade.