One of the market trends that has been getting an increasing amount of attention for the past few years is in electric vehicles. It’s easy to focus on companies like Tesla, Inc. (TSLA), NIO Inc. (NIO) and others because they are the companies producing the final product – the vehicle you get to slide behind the wheel and experience what it’s like to drive the “next big thing.” My contrarian nature to look for the businesses that provide and support those manufacturers prompts me to pay less attention to those stocks because they are the ones that everybody else is focusing on so I can find other companies those manufacturers are going to be relying on. That’s a big reason that I often gravitate to sub-industries like Auto Components.
When you’re looking for companies with exposure to the electric vehicle market, drilling down to sub-industries of the Auto industry gives you a way to find a much wider range of companies you can focus on, and that should benefit from expected, continued long-term growth adoption trends in electric vehicles. The Auto Components sub-industry, for example is made up of the companies that provide the materials, goods and services that all auto manufacturers, including EVs and hybrid vehicles require not only to build new products, but also to provide for the long-term maintenance of these vehicles. Practical examples include the need for replacement parts of every kind – something that EV’s are certainly not any more immune from than conventional vehicles, to basic components like mirrors, windows, car seats and more.
A lot of the companies in the Auto Components sub-industry have very interesting fundamental profiles, with value propositions that could make them look very compelling right now. For stocks like Lear Corporation (LEA), the largest customers are established names in conventional vehicles – Ford, General Motors, Fiat Chrysler, BMW, and Toyota – but remember that the EV and hybrid market includes these companies as well as trendier brands. Reports from many of the major auto manufacturers over the last year or so show that they are actively revamping their own product lines, which in many cases already include hybrid versions of popular models, but are also working to make many of those same models primarily electric in the near future. Auto Components companies like LEA also don’t necessarily rely only on new auto sales, but also on aftermarket demand as parts wear out and need to be replaced. Specific to EV’s, LEA’s E-Systems segment currently makes up about 25% of total annual revenues, where you might think that most of their exposure to EV’s comes from, but the Seating segment, which is larger revenue producer and also shows larger operating margins, has a healthy mix of value for both conventional as well as hybrid and electric vehicles. Does that mean that stocks like LEA have an attractive opportunity to take advantage of right now? Let’s find out.
Fundamental and Value Profile
Lear Corporation (Lear) is a supplier to the global automotive industry. The Company is engaged in supplying seating, electrical distribution systems and electronic modules, as well as related sub-systems, components and software, to automotive manufacturers. The Company’s segments include Seating and E-Systems. The Company serves the automotive and light truck market. The Seating segment consists of the design, development, engineering, just-in-time assembly and delivery of complete seat systems, as well as the design, development, engineering and manufacture of all seat components, including seat covers and surface materials, such as leather and fabric, seat structures and mechanisms, seat foam and headrests. The E-Systems segment consists of the design, development, engineering, manufacture, assembly and supply of electrical distribution systems, electronic modules and related components and software for light vehicles across the world. LEA’s current market cap is $10.8 billion.
Earnings and Sales Growth: Over the last twelve months, earnings decreased by almost -86% while revenues declined -12.9%. In the last quarter, earnings dropped by a little more than -78%, while sales decreased -10.35%. LEA operates with a historically narrow margin profile that has dipped into negative territory. In the last twelve months, LEA’s Net Income was 2.82% of Revenues, but slipped to -0.63% in the last quarter. That turn below zero is an indication that the company is paying out more than they are bringing in, which could a temporary, cyclical thing; however, with the strongly negative earnings and revenues pattern to go with it, this is a red flag that shouldn’t be dismissed.
Free Cash Flow: LEA’s free cash flow is about $698 million over the last twelve months. That marks an improvement from $577.1 million in the last quarter and -$196.4 million a year ago, which is a good counterpoint to the negative earnings and Net Income data mentioned above, and translates to a Free Cash Flow Yield of 2.82%.
Debt to Equity: LEA has a debt/equity ratio of .44. That is a conservative number that implies a conservative approach to the use of leverage. Their balance sheet shows about $1.1 billion in cash and liquid assets against about $2.1 billion in long-term debt.
Dividend: LEA pays an annual dividend of $3.08 per share, which translates to a yield of about 1.7% at the stock’s current price.
Price/Book Ratio: there are a lot of ways to measure how much a stock should be worth; but I like to work with a combination of Price/Book and Price/Cash Flow analysis. Together, these measurements provide a long-term, fair value target around $125 per share. That means the stock is significantly overvalued right now, with about -31% downside from its current price, and a practical discount price at around $100.
Technical Profile
Here’s a look at the stock’s latest technical chart.
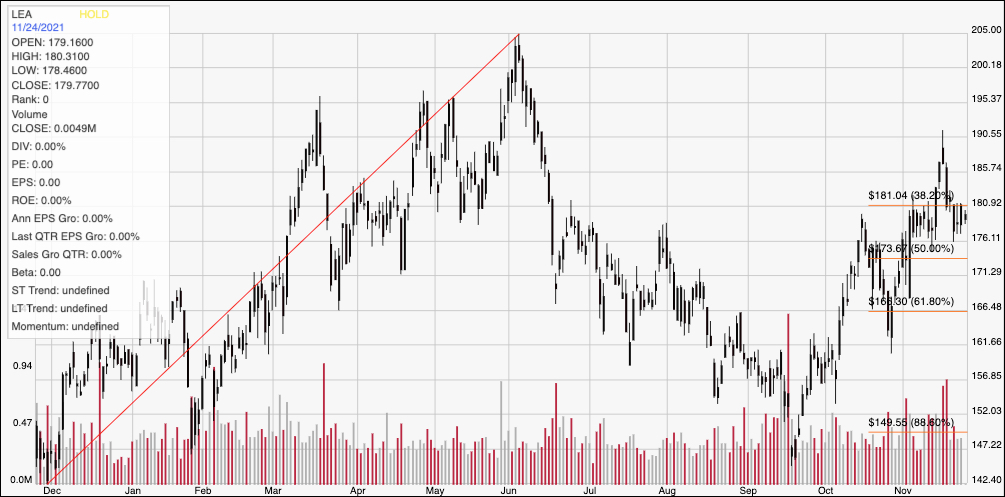
Current Price Action/Trends and Pivots: This chart displays the last year of price activity for LEA. The red diagonal line measures the stock’s upward trend from a December 2020 starting point around $142.50 to its peak in early June at around $205; it also informs the Fibonacci trend retracement lines shown on the right side of the chart. After dropping into a downward trend that didn’t find bottom until mid-September at around $145, the stock has reversed again, picking up a lot of of momentum that peaked last week at around $190 per share. The stock has faded a bit off of that high, and is currently sitting below the 38.2% retracement line, marking immediate resistance at around $181 per share. Current support is around $176, a little above the 50% retracement line and based on pivot activity in that price area from October, July, June, and April of this year. A break above resistance at $181 should give the stock room to test its recent peak at around $190, while a drop below $175 could see the stock drop to about $166.50 before finding next support right around the 61.8% retracement line.
Near-term Keys: LEA has been picking up quite a bit of bullish momentum since early October, which means that the stock’s recent pullback is just the kind of set up that a momentum-based trader could be looking for. If you prefer working with short-term trading strategies, that means that a push above $181 could be a good signal to think about buying the stock or working call options, with a useful profit target sitting at around $190 per share. A drop below $175 would a reason to consider shorting the stock or buying put option, with $166.50 acting as a good bearish profit target. The value proposition for LEA, unfortunately doesn’t exist at the stock’s current price level, which means that either the company’s fundamentals, including Net Income and Free Cash Flow need to show significant signs of improvement, or the stock needs to experience a severe drop in price to make the stock practical for a value-focused, long-term approach.