For a lot of different reasons, 2021 has been an interesting year for just about all of us. The pandemic has not abated this year as some experts predicted, and certainly as all of us hoped; the rise of the new COVID variants has kept pressures from the ongoing health crisis at the forefront of national commentary as well as economic concerns. Even so, the economy has shown a significant amount of strength; while things in many of the most obvious ways still haven’t recovered to pre-pandemic levels, the increasing pace of economic activity has been enough economists and analysts to start worrying about inflation, including the sustainability of economic progress so far and the much-feared spectre of rising interest rates. For investors, that means that for most of the year, stocks whose businesses thrive when the economy is growing have been in vogue. Those that tend to be a bit more defensive in nature have been noticeably less in favor. That’s reflective of something that economists like to call cyclicality, which just means that as economies ebb and flow through cycles of prosperity to scarcity and back again, so does the stock market.
Cyclical stocks are those that are expected to do well when economic conditions are generally healthy, and that will naturally struggle when the economy struggles. One of the core sectors of the economy that fits this very generalized description is the Transportation sector, which takes in a broad set of industries, including airlines, railroads, trucking and freight, overseas shipping, and so on.
Uncertainty and volatility amid signs that the economy is is struggling means that you can often find stocks in these industries trading at pretty significant discounts to their not-so-distant highs. That makes them tempting fodder for a contrarian, value-oriented investor. I like to pay attention to these stocks, because their fundamentals can give me some useful clues about their ability to weather an economic downturn. These are also stocks that, like any other, can see big swings from high to low based on nothing more than the market’s expectation for what the economy might do in the near future.
CSX Corporation (CSX) is a good example of the kind of stock I’m referring to. As one of the four largest transportation companies in the oligopoly that is the Road & Rail industry, this is a stock that is very sensitive to a variety of economic dynamics, from commodity and fuel prices to interest rate fluctuations. The collapse of oil prices during the pandemic might have been taken as a good thing for this sector, since fuel costs should generally be lower; but as economy activity ground to a halt during the second quarter of 2020, so too did the demand for transportation services.
From a bear market bottom in March of last year, the stock rebounded like most of the rest of the market as investors acted on the hope that the net economic effect would be temporary; in fact, the stock used the market’s broad, forward-looking and bullish hope of a recovery as a reason to push the stock from around $22 in July of last year to a peak in early May of this year at around $35. From that point, the stock dropped back to a short-term low at around $30 in late September. Since then, the stock has picked up a lot of bullish momentum, increasing in price a little more than 20% by the beginning of November. As of this writing, the stock is less than a dollar below that new, 52-week high point at around $36.50.
Cyclical stocks like CSX are sensitive to the kind of pressure I’ve just outlined, which is why it becomes important to take a critical look at the company’s balance sheet and overall fundamental strength. This is a company with a strong fundamental profile, and a balance sheet that has weathered the pandemic storm remarkably well. That is a positive sign that bodes well for the company in the long-term, but another question we have to answer is whether the stock’s current trading price represents a compelling enough value under current market conditions to justify taking its long-term opportunity seriously.
Fundamental and Value Profile
CSX Corporation is a transportation company. The Company provides rail-based freight transportation services, including traditional rail service and transport of intermodal containers and trailers, as well as other transportation services, such as rail-to-truck transfers and bulk commodity operations. The Company categorizes its products into three primary lines of business: merchandise, intermodal and coal. The Company’s intermodal business links customers to railroads through trucks and terminals. The Company’s merchandise business consists of shipments in markets, such as agricultural and food products, fertilizers, chemicals, automotive, metals and equipment, minerals and forest products. The Company’s coal business transports domestic coal, coke and iron ore to electricity-generating power plants, steel manufacturers and industrial plants, as well as export coal to deep-water port facilities. CSX has a current market cap of $78.9 billion.
Earnings and Sales Growth: Over the last twelve months, earnings increased about 34.4%, while sales increased 24.3%. In the last quarter, earnings grew by 7.5% while sales were about 10% higher. CSX operates with a healthy, robust margin profile that has been remarkably resilient; in the last twelve months, Net Income was a little more than 30% of Revenues and weakened only slightly to 29.4% in the last quarter.
Free Cash Flow: CSX’ Free Cash Flow is healthy, at more $3.6 billion. That marks an improvement from about $3.1 billion in the quarter prior, and about $2.7 billion a year ago. Their current Free Cash Flow number translates to a Free Cash Flow Yield of 4.59%.
Debt to Equity: CSX has a debt/equity ratio of 1.23. This indicates the company is highly leveraged; but this is also very typical of stocks in the Transportation industry. Their balance sheet indicates they have about $2.1 billion in cash and liquid assets against $16.2 billion in long-term debt as of the most recent quarter. The company’s operating profile suggests there should be no problem servicing the debt they carry.
Dividend: CSX pays an annual dividend of $.37 per share, which at its current price translates to a dividend yield of about 1.05%. Their dividend payout ratio is also conservative, at less than 25% of their earnings over the last year.
Price/Book Ratio: there are a lot of ways to measure how much a stock should be worth; but I like to work with a combination of Price/Book and Price/Cash Flow analysis. Together, these measurements provide a long-term, fair value target around $32.46 per share. That means the stock is overvalued at its current price, with -9% upside from its current price, and with a useful bargain price at around $26.
Technical Profile
Here’s a look at the stock’s latest technical chart.
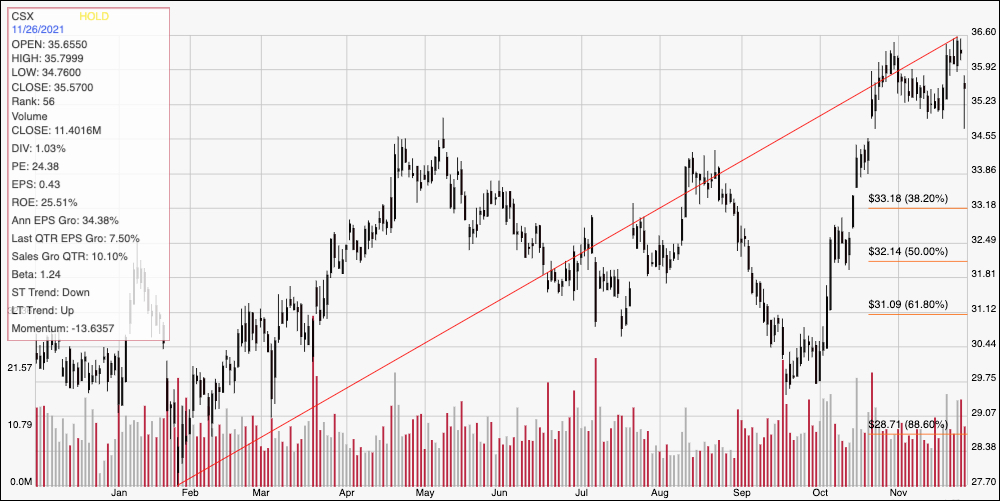
Current Price Action/Trends and Pivots: The chart above displays the past year of price activity for CSX. The red diagonal line traces the stock’s upward trend from its February 2021 low at around $28 to its peak a couple of days ago at about $36.50. It also provides the baseline for the Fibonacci retracement levels outlined on the right side of the chart. Since the beginning of November, the stock held a narrow trading range between current support at around $35 and immediate resistance at $36.50. At the end of last week, headlines about the latest coronavirus variant discovered in South Africa prompted a hard sell-off throughout the market that saw CSX drop off its peak overnight and test support at $35. The stock appears to be bouncing back in early trading today. A push above $36.50 would set a new 52-week high, and could see upside to about $38.50 (using the last, $2 distance between the last support break at $34.50 and immediate resistance as a reference point), while a drop below $35 should find next support somewhere between $34.50 and $34.
Near-term Keys: From a long-term perspective, it’s hard to see a lot of long-term upside in CSX, despite its strong fundamental profile. While Free Cash Flow is increasing, I also the company’s decline in cash and liquid assets as a red flag that bears watching. Based on the fair value analysis I described earlier, the stock wouldn’t offer a compelling value-based price unless it drops to around $26 per share – which is about -28% below the stock’s current price. That means the best opportunities to work with the stock are with short-term, momentum-oriented trades. A push above $36.50 could offer a signal to consider buying the stock or working with call options, with a useful target price at around $38.50. The stock’s current bullish strength also means that there is very limited foreseeable downside below current support, which also means that looking for a bearish trade right now is a very low-probability prospect. For functional purposes, I think the stock would need to drop below the 38.2% retracement line at around $33 to fully reverse its current bullish momentum and offer any kind of practical bearish trading set up.