This week has seen the market reclaim much of the ground it gave up after Thanksgiving, as fears about the new omicron coronavirus variant have eased as indications are that while it is, indeed highly contagious, it also seems to be less severe than other variants, like delta that continue to plague global health systems. Economic indicators are also continuing to show strength, with the latest jobs numbers showing a drop in unemployment claims to less than 190,000 in the last week and the latest level recorded in 50 years.
This looks like the market could be preparing for a fresh new push to yet another, new all-time high, and concurrent extension of the market’s long-term bullish trend, but as always it doesn’t mean that there aren’t elements investors shouldn’t be aware of. The Fed is still mulling the timing of its transition from market-friendly, accommodative bond buying and is paying stricter attention to inflation indices than to jobs and employment figures. That’s a switch from the policy of the past few years, dating back to former Fed chair Janet Yellen’s time at the head of the central bank that I think shouldn’t be overlooked, and signals the potential for a more hawkish Fed than we have seen in some time.
One area that has remained resilient throughout the past year and a half is the Food Products industry. For most of this year, stocks in this industry haven’t just kept pace with the market, but in many cases outperformed the sexier, growth-driven industries and names; as measured by the S&P 500 Consumer Staples SPDR (XLP), the sector that these stocks reside in has moved nearly 20% higher since November of 2020. Diving into the fundamentals of many of these companies show balance sheets that continue to weather the pandemic storm better than most other industries in 2020, and in a number of cases have managed to improve even more in 2021. That increasing fundamental strength has been a big driver in stock price performance, but even with significant moves higher, the fundamental strength has also grown enough to keep the value proposition attractive.
Tyson Foods Inc. (TSN), is a stock I’ve followed for some time. 2020 wasn’t good for the stock; from a January peak at around $94, the stock began a downward slide that only accelerated in March as the entire stock market moved into bear market territory. TSN did find a bottom at around $44 with the rest of the market, and then managed to recover to an August 2020 peak at around $65 per share. By the end of 2020, the stock was sitting at around $62.50. This year has seen the stock extend its long-term upward trend even more, hitting a 52-week high in mid-November at around $86. Broad market uncertainty after Thanksgiving pushed the stock down to about $78.50 to start December, but the stock is now sitting just a couple of dollars short of that high point.
The company has invested heavily since early 2020 to address safety concerns, and that is something that in the early stage of the health crisis acted as a drag on the bottom line; but the company’s most recent earnings reports suggest not only that it continues to navigate those short-term, coronavirus-driven headwinds, but that it has benefited from increases in protein demand in the U.S. and overseas. An epidemic of African Swine Flu in 2018 ravaged the domestic hog population in China, the world’s largest pork producer and exporter, leaving a long-term protein shortage that is expected to continue for years to come, and puts U.S. protein producers like TSN in a position of strength. Compared against the stock’s upward trend, does that mean the stock is priced too high for effective value, or is there still room for more?
Fundamental and Value Profile
Tyson Foods, Inc. is a food company, which is engaged in offering chicken, beef and pork, as well as prepared foods. The Company offers food products under Tyson, Jimmy Dean, Hillshire Farm, Sara Lee, Ball Park, Wright, Aidells and State Fair brands. The Company operates through four segments: Chicken, Beef, Pork and Prepared Foods. It operates a vertically integrated chicken production process, which consists of breeding stock, contract growers, feed production, processing, further-processing, marketing and transportation of chicken and related allied products, including animal and pet food ingredients. Through its subsidiary, Cobb-Vantress, Inc. (Cobb), the Company is engaged in supplying poultry breeding stock across the world. It produces a range of fresh, frozen and refrigerated food products. Its products are marketed and sold by its sales staff to grocery retailers, grocery wholesalers, meat distributors, warehouse club stores and military commissaries, among others. TSN has a current market cap of $30.2 billion.
Earnings and Sales Growth: Over the last twelve months, earnings increased a little more than 27%, while sales increased 11.79%. In the last quarter, earnings were nearly -15% lower while sales grew about 2.67%. TSN operates with a modest, but strengthening margin profile; in the last twelve months, Net Income was 6.48% of Revenues, but increased to 10.58% in the last quarter.
Free Cash Flow: TSN’s Free Cash Flow is healthy, at a little more than $2.63 billion. That number has increased from about $1.6 billion at the beginning of 2020, but dipped from about $2.8 billion two quarters ago. Its current level translates to a useful Free Cash Flow yield of 8.63%.
Debt to Equity: TSN has a debt/equity ratio of .46, which is conservative. Cash and liquid assets were about $437 million at the end of 2019 and increased to $2.4 billion at the end of 2020, and were $2.5 billion in the last quarter. TSN carries about $8.3 billion in long-term debt. The company’s operating profile indicates there should be no problem servicing debt, with the company demonstrating the ability to navigate cyclical and economic challenges successfully from quarter to quarter as they come.
Dividend: TSN increased its annual dividend from $1.68 per share to $1.78 per share in 2020, and again to $1.84 per share in the last quarter. That new number translates to a dividend yield of 2.2% at the stock’s current price. TSN’s dividend has also increased from $1.20 per share in late 2018, and $1.52 at the end of 2019. The fact that management not only maintained the higher dividend, but increased it during the pandemic despite the early challenges it had to deal with in adjusting to pandemic-driven operating conditions is noteworthy since so many other companies have been reducing or suspending their dividends.
Price/Book Ratio: there are a lot of ways to measure how much a stock should be worth; but I like to work with a combination of Price/Book and Price/Cash Flow analysis. Together, these measurements provide a long-term, fair value target around $92.50 per share. That means that even with the stock’s sizable increase this year, it still offers an interesting, but not quite compelling bargain proposition, with 12% upside from its current price, and a practical discount price at around $74 per share.
Technical Profile
Here’s a look at the stock’s latest technical chart.
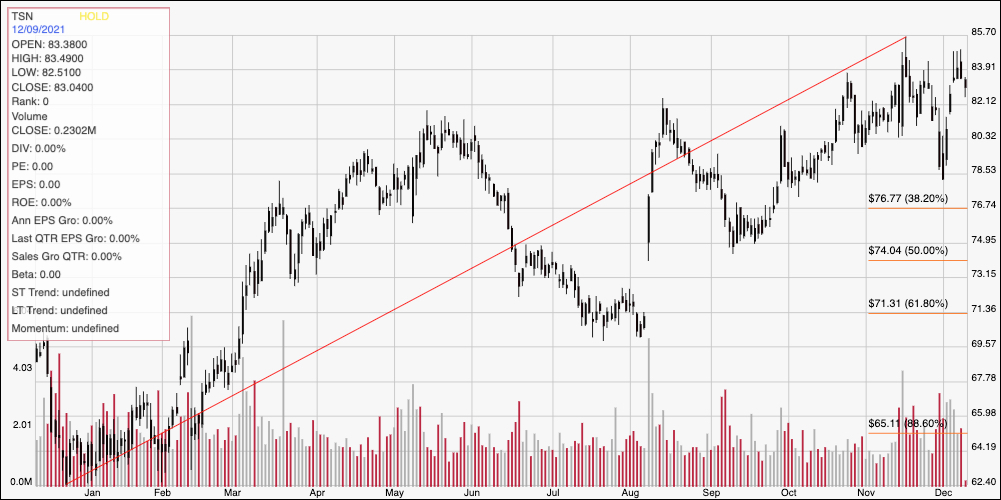
Current Price Action/Trends and Pivots: The diagonal red line outlines the stock’s upward trend from July of last year beginning at around $62.50 and tracing to its November high at around $86. It also provides the baseline for the Fibonacci retracement lines shown on the right side of the chart. After dropping to around $78.50 by the start of December, the stock has picked up momentum again, reaching a new peak at around $84 to mark immediate resistance this week. Current support is around $82. A push above $84 should test the stock’s 52-week high around $86, while a drop below $82 should find next support at around $80 per share.
Near-term Keys: TSN’s value proposition is interesting, even with the stock’s long upward trend, and could make for a reasonable long-term opportunity if you’re willing to be patient. The stock is also near a 52-week high, which suggests that near-term upside could remain limited, and that is why I think there is also an argument to wait for the stock to possibly retrace to a more attractive valuation level before looking for a new, value-based entry point. If you prefer to work with short-term term trading strategies, you could also use a push above $84 as a signal to buy the stock or work with call options, with a useful profit target between $86 if bullish momentum accelerates. A drop below $82 could offer a signal to consider shorting the stock or buying put options, using $80 as a first, quick-hit profit target on a bearish trade.