The Tech sector has enjoyed a lion’s share of attention among all segments of the economy for a number of years. Throughout the pandemic, that attention only seemed both intensified and justified, as technology companies provided the tools that allowed much of corporate America to keep things going by shifting their workforces to remote working models. That motivated investors to buy those stocks enthusiastically, which is a big reason that the sector not only moved past its pre-pandemic highs, but surged more than 40% from that high-water mark to establish a new all-time high in April of this year, as measured by the S&P 500 Technology SPDR ETF (XLK). Despite that big upward move, there were some stocks that definitely did not keep pace. That is always true in any sector, no matter what the broad sector momentum looks like; there are always individual companies that will diverge from the normal pattern.
For example, since early 2020, companies that focus on the “enterprise” space – where most corporate tech spending has traditionally gone, for products like servers, computers, printers, and the tools to connect them all in a traditional network setting, for example – have struggled to keep up. Some analysts have speculated how much of the work-from-home element of corporate operations will become a permanent part of business life, which means that some of the capital normally allocated to in-office tech solutions are likely to stay allocated to solutions and services that continue to facilitate remote work. Even so, there are also signs that for many businesses, back-in-office is becoming an increasing expectation. That could mean that while many of the companies that operate in the Enterprise space could continue to be pressured throughout 2021, revenues and earnings in many cases have also likely begun their own recovery.
That brings us to today’s highlight. Hewlett Packard Enterprise Co. (HPE) is a spin off of Hewlett Packard Corporation (HPQ), and a business that is among those companies that underperformed through most of 2020, falling from a pre-pandemic high at around $16.50 at the end of 2019 to a March low at around $7.40. It mostly hovered within a couple of dollars of that low until November 2020, when the stock started picking up a lot of bullish momentum; in fact, from that starting point a little above $8 in November, the stock rallied to $12 per share by the end of 2020. From that point, the momentum accelerated even more, pushing the stock to a consolidation range a little above the stock’s pre-pandemic highs, and a little below $17 in June. Over the last few months, the stock’s movement has been pretty cyclic but relatively range-bound between $13.50 on the low end and $15.50 at the top end, More recently, the stock has dropped off of resistance around the top of that range and could be approaching near-term support. This is a company that has been seeing some material improvements in its fundamental strength and its value proposition, which I think makes it a good stock to be thinking using for a functional, value-based investment right now.
Fundamental and Value Profile
Hewlett Packard Enterprise Company (HPE) is an edge-to-cloud platform-as-a-service company. The Company’s segments include Compute, High Performance Compute & Mission-Critical Systems (HPC & MCS), Storage, Advisory and Professional Services (A & PS), Intelligent Edge, Financial Services (FS), and Corporate Investments. The Compute portfolio offers both general-purpose servers for multi-workload computing and workload-optimized servers. HPC & MCS portfolio offers workload-optimized servers designed to support specific use cases. FS provides investment solutions, such as leasing, financing, information technology (IT) consumption, and utility programs and asset management services, for customers that facilitate technology deployment models and the acquisition of complete IT solutions, including hardware, software and services from HPE and others. Corporate Investments include Hewlett Packard Labs, which is responsible for research and development. HPE has a current market cap of $19 billion.
Earnings and Sales Growth: Over the past year, earnings increased more than 416%, while sales increased by 2.03%. In the last quarter, earnings strengthened by more than 558% (these aren’t typos), while sales were about 6.63% higher. The company operated with a narrow margin profile through 2020 that has seen big improvements in 2021; over the last twelve months, Net Income was 12.33% of Revenues, and increased to 34.72% in the last quarter.
Free Cash Flow: HPE’s Free Cash Flow is robust, at more than $3.7 billion. On a Free Cash Flow Yield basis, that translates to 18.71%. A year ago, Free Cash Flow was $1.3 billion. The improvement over the course of the year is a good indication of the company’s ability to survive the pandemic and to emerge in a stronger position than it was in when it started.
Debt to Equity: HPE has a debt/equity ratio of .49, which is a conservative number. Their balance sheet shows about $4 billion in cash against a little less than $9.9 billion in long-term debt. Their operating profits are adequate to service their debt, with very health financial flexibility as well.
Dividend: HPE pays a dividend of $.48 per share, which translates to an annual yield of about 3.25% at the stock’s current price. I think that it is also noteworthy that the company has not cut or reduced their dividend; in fact it remains a bit above the $.44 per share payout they maintained until the beginning of 2020, when management increased the dividend to its current level.
Price/Book Ratio: there are a lot of ways to measure how much a stock should be worth; but I like to worth with a combination of Price/Book and Price/Cash Flow analysis. Together, these measurements provide a long-term target at about $18.50 per share. That suggests that HPE’s stock is undervalued, with about 26% upside from its current price.
Technical Profile
Here’s a look at the stock’s latest technical chart.
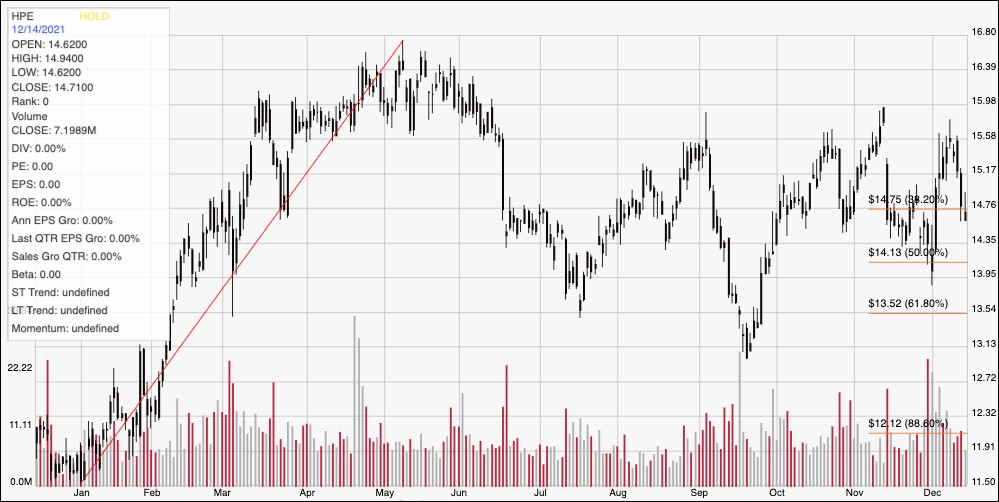
Current Price Action/Trends and Pivots: The chart above traces the last year of price activity for HPE. The red diagonal line traces the stock’s upward trend from a low point in January 2021 at around $11.50 to its peak in early May a little below $17. It also provides the baseline for the Fibonacci retracement lines shown on the right side of the chart. The stock’s range since July looks volatile, but in reality has tightened in the last month or so, with current support at around $14 and $15.50 acting as immediate resistance. A push above $15.50 should have at least enough short-term room to test the stock’s 52-week high at nearly $17. A drop below $14 should see limited downside with next support anywhere between $13.50 and $13 per share.
Near-term Keys: HPE looks like it is in a good position to reverse the current downward trend, with limited downside between the stock’s current price level and expected support. That means that if you prefer to look for short-term, momentum-based trading strategies, the best probabilities lie on the bullish side. You can use a push above $15.50 as a good signal to consider buying the stock or working with call options, with a near-term profit target at around $17, with additional room to go if buying activity picks up. Looking for a bearish trade is a lower-probability prospect right now, with the stock sitting very close to both primary and secondary support levels. If the stock breaks below $13.50, you could consider shorting the stock or buying put options, with an eye on $12.50 as a first-hit profit target and additional downside possible to about $12, where the 88.6% retracement line waits if selling activity accelerates. The stock’s value proposition, in the meantime if very attractive, with a solid set of fundamentals behind the stock’s current price action that I think make HPE an interesting, value-based opportunity.