One of the big themes this year of the “reopening” trade has come from a generally expected increase in consumer activity in activities that were almost completely restricted in 2020 such as travel to take vacations. That generally implies consumer demand for airlines, hotel bookings, and resorts should also increase, which is typically good news for the Energy sector.
That anticipation for increased demand early in the year – followed by indicators that confirmed demand for these activities was actually increasing – has pushed big increases in price for the commodity; from a starting point below $50 per barrel in January, for example West Texas Intermediate (WTI) crude is now sitting at around $70.50 per barrel. The increase is generally also being seen at the pump – which is generally good news for stocks in the Energy sector. One of the possible exceptions, however applies to oil refiners, who have the difficult role of trying to find a balance between cost-efficiency in crude and passing cost increases downstream through the energy supply chain. Increased prices of the raw commodity generally make that task more difficult and weigh on the profitability of refiners, including the largest, industry leaders.
Phillips 66 (PSX) is one of the largest refiners in the United States, and that came into 2020 in better position than most other companies in its industry. While oil refining is its primary business, it also had the foresight to position itself before the downturn, diversifying into crude storage and shale pipeline projects to alleviate congestion in the Permian Basin and Eagle Ford areas, where a large amount of U.S. shale had been held up by pipeline limitations. They were also aided by an increase in consumer demand in its chemicals business, including packaging for cleaning products. Those are areas that helped to minimize, while not entirely offset the near-term effect of cratered demand for refined crude in 2020. After finally finding a bottom in November of last year at around $43, the stock rallied into an extended upward trend that peaked in June at around $94.50 per share. The stock dropped into a downward trend from that point, hitting a low in September at around $68 before staging a new, temporary rally to about $84 in late October. The stock has dropped back again from that peak, now sitting at around $69, just a few dollars above that September low price. Recent earnings reports have suggested that the impact of reduced demand, along with more recent, increasing refining costs have had an impact on the company’s fundamental strength this year; but they also show that the company has begun to turn the corner back to profitability. Does that mean the stock’s current price is actually a new opportunity for value investors? Let’s find out!
Fundamental and Value Profile
Phillips 66 is an energy manufacturing and logistics company with midstream, chemicals, refining, and marketing and specialties businesses. The Company operates through four segments: Midstream, Chemicals, Refining, and Marketing and Specialties (M&S). The Midstream segment gathers, processes, transports and markets natural gas, and transports, stores, fractionates and markets natural gas liquids (NGLs) in the United States. The Chemicals segment consists of its equity investment in Chevron Phillips Chemical Company LLC (CPChem), which manufactures and markets petrochemicals and plastics. The Refining segment buys, sells and refines crude oil and other feedstocks at refineries in the United States and Europe. The M&S segment purchases for resale and markets refined petroleum products, such as gasolines, distillates and aviation fuels, primarily in the United States and Europe, as well as includes the manufacturing and marketing of specialty products, and power generation operations. PSX’s current market cap is $31.4 billion.
Earnings and Sales Growth: Over the last twelve months, earnings increased by nearly 32,000% (not a typo), while sales increased more than 93%. In the last quarter, earnings improved by almost 330%, while sales were about 13% higher. After spending most of the last year in negative territory, the company’s margin profile has also turned positive; over the last twelve months, Net Income was -0.5% of Revenues, and improved to 1.33% in the last quarter.
Free Cash Flow: PSX’s free cash flow was about $3.09 billion for the trailing twelve month period. This measurement confirms the turnaround I just described using Net Income, and provides a more comprehensive view of the company’s recovery, as Free Cash flow was -$163 million six months ago and -$809 billion a year ago.
Debt to Equity: PSX has a debt/equity ratio of .65, a generally conservative number that indicates the company operates with a conservative philosophy about leverage. Their balance sheet shows about $2.9 billion in cash and liquid assets versus $13.4 billion in long-term debt. It is worth noting that in July of this year, long-term debt was almost $16 billion while cash was around $1.3 billion.
Dividend: PSX pays an annual dividend of $3.68 per share, which translates to a yield of almost 5.3% at the stock’s current price. Management maintained the dividend at $3.60 per share throughout the pandemic’s challenges, and managed to reverse the negative profitability trend from prior quarters without resorting to more drastic measures like cutting or eliminating the dividend to preserve cash; they also increased the dividend after the most recent earnings report to provide even more confirmation of their confidence in the company’s long-term prospects.
Price/Book Ratio: there are a lot of ways to measure how much a stock should be worth; but I like to work with a combination of Price/Book and Price/Cash Flow analysis. Together, these measurements provide a long-term, fair value target around $96 per share. That suggests that PSX is very nicely undervalued, by about 38% at the stock’s current price. It is also worth noting that in July, this same analysis yielded a long-term target price at around $52 per share and $84 per share in September.
Technical Profile
Here’s a look at the stock’s latest technical chart.
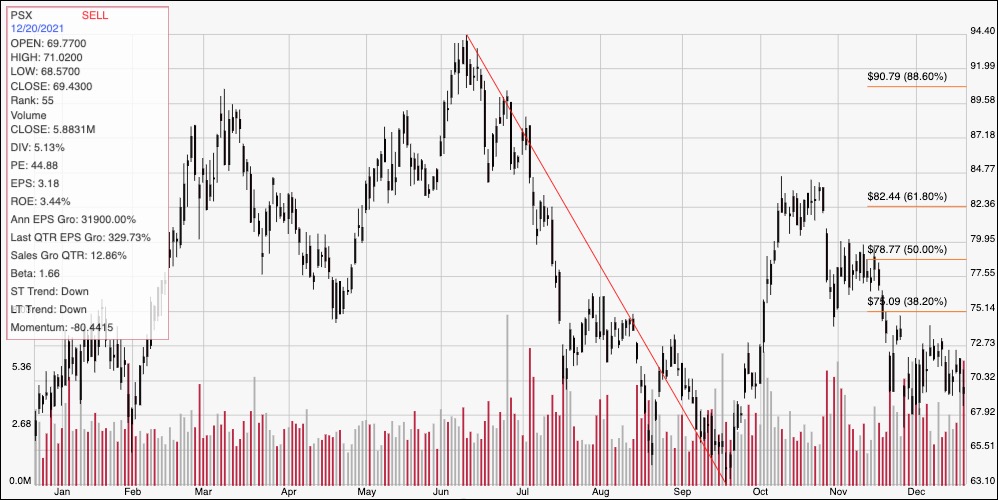
Current Price Action/Trends and Pivots: The chart above shows the stock’s price action over the past year. The red diagonal line traces the stock’s trend from a peak in June at around $94.50 to its September low at around $63. It also provides the baseline for the Fibonacci retracement lines on the right side of the chart. After temporarily rallying to a peak at around $84 in October, the stock dropped back to hit current support at around $68 at the beginning of December. The stock has begun to settle into a consolidation range this month, with immediate resistance at around $73 per share. A push above $73 should find next resistance at around $75, while a drop below $68 has downside to between $65 and $63 per share.
Near-term Keys: Given the improving fundamental picture that I think accurately reflects not only the challenges PSX has been dealing with for the past year and a half, but also their ability to navigate them successfully, it isn’t hard to understand the stock’s deeply undervalued status. I also think that means that the stock’s current bearish momentum is a sign of increasing long-term opportunity; the Energy sector is one of the areas of the market under current conditions that is offering the most attractive valuation levels. For stocks like PSX that are also at or near historical lows, that also suggests that downside should be limited, which improves the value-based opportunity even more. If you prefer to work with short-term trading strategies, you could use a bounce off of support at around $68 as a strong signal to consider buying the stock or working with call options, with $73 to $75 acting as a very attractive initial bullish profit target. A drop below $68 could also act as an interesting bearish signal; in that cases, you could consider shorting the stock or buying put options, using $65 to $63 as useful targets on a bearish trade.