One of the fairly consistent themes of 2021 has been the impact of the global pandemic on different pockets of the economy. While everybody is anxious to look past the days of social isolation, quarantine and shelter-in-place requirements at the early stages of the crisis, and talk about seeing life get “back to normal,” the plain truth is that it isn’t over. The market’s activity after the Thanksgiving break, with an increase in bearish momentum as reports of the new omicron variant’s elevated contagiousness have been confirmed with new spikes in infection rates – enough that during the Christmas weekend, airlines cancelled or delayed a number of flights across the United States. While the market is picking up momentum on the bullish side post-Christmas, that temporary uncertainty was sufficient to drive a number of stocks off of their previous highs and to levels that have started to look more attractive from a value-based perspective.
One pocket of the economy that really took a big hit during the pandemic is big-box department stores. While other specialty retailers found ways to adjust, absorb the negative impact that initial shutdowns imposed and emerge hopefully better equipped for the future, department stores like Kohl’s Corporation (KSS) were already struggling to adjust to shifting consumer preferences towards online shopping and reliance on private labels and brands before the pandemic began. KSS borrowed heavily to bolster its cash and liquid assets early during the pandemic, which enabled the company to absorb much of the blow they took from an extended shutdown period.
The company’s latest earnings reports shows that a number of important fundamental metrics, including Free Cash Flow and cash and liquid assets have seen material improvements throughout 2021. That looks like a good sign that the company has not only survived the worst, but also turned the corner to profitability and is in good position to respond to whatever conditions – good or bad – lie ahead. The stock hit a peak in May at around $65 per share before falling back to find a strong support level at around $$4.50 in October. From that point, the stock rallied strongly, hitting a high point in mid-November at around $62 per share before the broad market uncertainty I described above came to bear and pushed the stock sharply down again. The stock now appears to have found new support in the $46 area, and is building new bullish momentum from that point. From a value-based perspective, the stock’s valuation metrics have seen significant improvement as the stock’s price has dropped. Are all of these elements together enough to make the stock a useful value you should be thinking about right now? Let’s find out.
Fundamental and Value Profile
Kohl’s Corporation (Kohl’s) is an operator of department stores. The Company operates approximately 1,154 Kohl’s department stores, a Website (www.Kohls.com), approximately 12 FILA outlets, and approximately three Off-Aisle clearance centers. The Company’s stores and Website sell moderately-priced private label and national brand apparel, footwear, accessories, beauty and home products. The Company’s Website includes merchandise that is available in its stores, as well as merchandise that is available only online. The Company’s merchandise mix includes both national brands and private brands that are available only at Kohl’s. The Company’s private brands include Apt. 9, Croft & Barrow, Jumping Beans, SO and Sonoma Goods for Life. The Company’s exclusive brands include Food Network, Jennifer Lopez, Marc Anthony, Rock & Republic and Simply Vera Vera Wang. KSS’s current market cap is $8.3 billion.
Earnings and Sales Growth: Over the last twelve months, earnings increased by 16,400% (no, that isn’t typo), whiles sales increased a little more than 15.6%. In the last quarter, earnings declined by about -33.5%, while sales improved by 3.44%. The company’s margin profile has historically been narrow, which does represent a risk element of which to be cautious, but has reversed the pattern of negative Net Income of 2020 and is showing solid signs of stabilization. In the last twelve months, Net Income was 5.15% of Revenues, and 5.28% in the last quarter. I take the turn from the last year’s negative pattern as a mostly positive sign, with an eye on the quarters ahead to see if the pattern continues or changes.
Free Cash Flow: KSS’s free cash flow is healthy, at $1.74 billion. That marks an increase from about $1.275 billion a year ago, but did drop from $2.4 billion in the previous quarter. The current number translates to a very healthy Free Cash Flow Yield of 24.67%.
Debt to Equity: KSS has a debt/equity ratio of .81. Cash and liquid assets were about $1.8 billion in the last quarter, a decrease from $2.56 billion in the previous quarter, but are still above the $1.6 billion level registered two quarters previously, while debt increased from $400 million in the middle of 2018 to $1.9 billion in the most recent quarter. This number has declined from $3.4 billion six months ago, which I think confirms their ability to pay down debt (the company borrowed heavily at the onset of the pandemic, pushing long-term debt to more than $6 billion) while increasing liquidity and is a big reason management announced the resumption of dividend distributions in the first quarter of 2021.
Dividend: KSS reinstated its dividend in the first quarter of 2021 at a rate of $1.00 per share, which translate to an annualized dividend yield of 1.97% at the stock’s current price.
Price/Book Ratio: there are a lot of ways to measure how much a stock should be worth; but I like to work with a combination of Price/Book and Price/Cash Flow analysis. Together, these measurements provide a long-term, fair value target around $69 per share. That suggests that the stock is undervalue right now by 38%.
Technical Profile
Here’s a look at the stock’s latest technical chart.
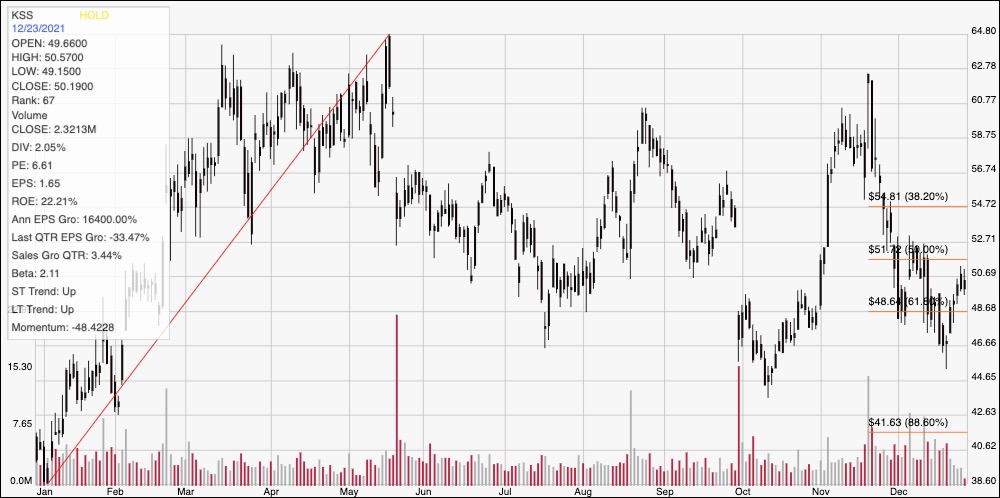
Current Price Action/Trends and Pivots: The chart above shows the last year of price movement for KSS. The red diagonal line traces the stock’s upward trend from a January low at about $38.60 to its peak around $65 in May. It also provides the baseline for the Fibonacci retracement lines shown on the right side of the chart. After falling back to a temporary support point at around $44.50 in October, the stock staged a short-term rally to around $62 before dropping back again from late November until last week. Since then, the stock has picked up bullish momentum again, with $48.50 providing current support, and immediate resistance expected to lie at around $51. A push above $51 should give the stock room to push to about $55 before finding next support, while a drop below $48.50 could find next support at around $45, where the stock bottomed in mid-November.
Near-term Keys: KSS’s drop in the last month has only improved the stock’s value opportunity, while the last quarter’s earnings report strongly suggest the company is on solid footing. Altogether, this is a stock that I think is worth paying attention to as a useful value-based opportunity. If you prefer to focus on short-term trading strategies, you could use a push above $51 as an interesting signal to consider buying the stock or working with call options, using $55 as practical profit target. A drop below $48.50 should be taken as a sign to consider shorting the stock or buying put options, using $48.50 per share as a good bearish profit target.