Since the beginning of 2021, the energy sector has rebounded strongly from the pandemic-driven pressures that had kept prices – particularly in crude oil – depressed throughout 2020. From a November 2020 low point at around $34, for example, West Texas Intermediate (WTI) crude more than doubled to an October peak at around $85. The rollout of coronavirus vaccines at the beginning of the year stoked optimism that a return to “normal” activities was in sight this year, and even though variants have kept the health crisis front and center throughout the year, economic activity has remained high, including demand for crude oil, which is why WTI crude is around $76 as of this writing.
It’s true that many of the largest, most recognizable names in the sector absorbed big blows to operating margins in the form of negative net income and declining profitability as reflected by measurements like earnings and free cash flow last year, but the increase in oil demand this year has given many of these companies a tailwind to help drive measurable improvements in their balance sheets and so to follow through on many of the fundamental metrics that I like to focus on.
Schlumberger N.V. (SLB) is one of the largest companies in the world in the Energy Equipment & Services industry. Its stock price has pretty much mirrored that of the rest of the energy sector, dropping from around $42.50 before the pandemic to a March 2020 low around $12. After rallying shortly, and then falling back near to its bear market low in October of last year, the stock followed the broad market, and a lot of other stocks in the sector into a strong upward trend, with the early summer peak in oil prices roughly coinciding with SLB’s June peak at around $37 per share. From that point, the stock has vacillated back and forth between a low at around $27 and an October peak at around $34.50. More recently, the stock has begun to consolidate in a range between $31 and $29, suggesting that the stock could continue to move in that narrow range for the near term. SLB’s fundamental profile shows many of the kind of improvements – like increasing cash flow, improving liquidity and strengthening operating metrics that could be a strong indication it has turned the corner from drastic, pandemic-induced drawdowns. Is that good enough to make a case for SLB as a tempting value prospect? Let’s take a look.
Fundamental and Value Profile
Schlumberger N.V. provides technology for reservoir characterization, drilling, production and processing to the oil and gas industry. The Company’s segments include Reservoir Characterization Group, Drilling Group, Production Group and Cameron Group. The Reservoir Characterization Group consists of the principal technologies involved in finding and defining hydrocarbon resources. The Drilling Group consists of the principal technologies involved in the drilling and positioning of oil and gas wells. The Production Group consists of the principal technologies involved in the lifetime production of oil and gas reservoirs and includes Well Services, Completions, Artificial Lift, Integrated Production Services (IPS) and Schlumberger Production Management (SPM). The Cameron Group consists of the principal technologies involved in pressure and flow control for drilling and intervention rigs, oil and gas wells and production facilities. SLB has a current market cap of $41.6 billion.
Earnings and Sales Growth: Over the last twelve months, earnings increased 125%, while sales were 11.2% higher. In the last quarter, earnings improved by 20% while sales grew by 3.78%. SLB’s operating profile matches its earnings pattern; Net Income versus Revenue over the last year was 7.44%, and strengthened in the last quarter to 9.41%. This metric was soundly negative in 2020, and the turn to positive Net Income on a quarterly basis has extended now for multiple quarters, which I take as a strong indication the company has successfully navigated its way through the worst effects of the pandemic.
Free Cash Flow: SLB’s Free Cash Flow is generally healthy and improving, at a little more than $2.6 billion over the last twelve months. That represents an improvement from $2.1 billion in the quarter prior and about $1.8 billion a year ago. The current number translates to a Free Cash Flow Yield of 6.36%.
Debt to Equity: SLB has a debt/equity ratio of 1.05, which indicates the company is highly leveraged. That isn’t particularly surprising given that a number of companies in the Energy sector borrowed heavily in part to bolster their balance sheets during the worst of the pandemic. Cash and liquid assets in the last quarter were about $2.9 billion versus about $14.3 billion in long-term debt. it is worth mentioning that a year ago, long-term was more than $16 billion. The company’s operating profile suggest the company should have no problem servicing its debt.
Dividend: SLB pays an annual dividend of $.50 per share (reduced from about $2.00 per share in 2019, which is no surprise given the erosion of the company’s profitability), which at its current price translates to a dividend yield of about 1.69%.
Price/Book Ratio: there are a lot of ways to measure how much a stock should be worth; but I like to worth with a combination of Price/Book and Price/Cash Flow analysis. Together, these measurements provide a long-term target at almost $26.50 per share. That means the stock is overvalued, with about -10% downside from the stock’s current price, and a useful discount at around $21. It is also worth noting that a few months ago, this same analysis yielded a fair value target at around $23.50.
Technical Profile
Here’s a look at the stock’s latest technical chart.
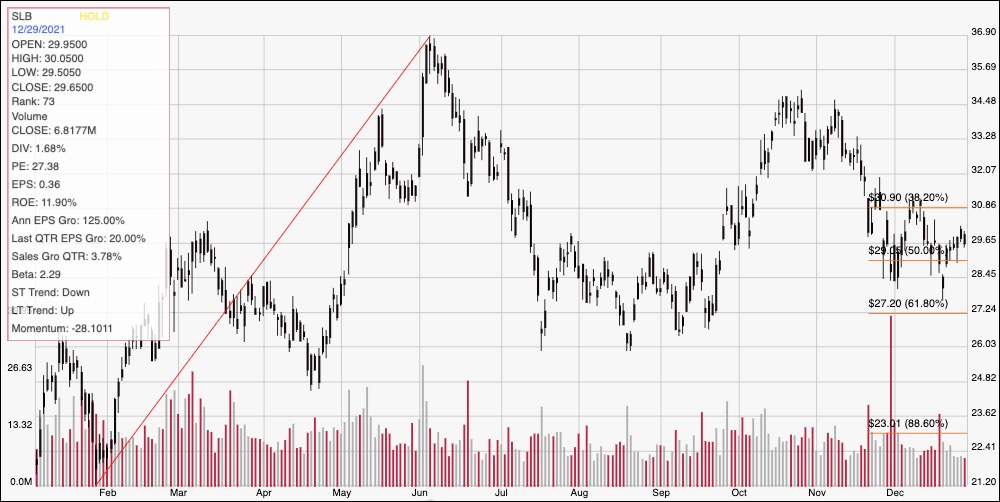
Current Price Action/Trends and Pivots: The chart above displays the last year of price activity, with the diagonal red line tracing the stock’s rally from about $21 in February to a peak at around $37 in June. It also provides the baseline for the Fibonacci retracement lines shown on the right side of the chart. The stock fell to a low at around $26 in July, but rallied back again to an October peak around $34.50 before dropping back into its current range since Thanksgiving. Current support is right around the 50% retracement line, in the $29 price area while immediate resistance is around $31 where the 38.2% retracement line sits. A push above $31 should give the stock room and momentum to test its November peak around $34.50, while a drop below $29 should find next support around $27 where the 61.8% retracement line waits.
Near-term Keys: There really isn’t any way to suggest that SLB’s value proposition right now is useful, even with the company’s clearly improving fundamental profile. That means that the best probabilities to work with this stock lie with short-term trading strategies; if the stock drops below $29, consider shorting the stock or buying put options, using $27 as a practical, quick-hit profit target. A rally and break above $31 could offer an interesting signal to buy the stock or work with call options, using the stock’s last peak at $34.50 providing a useful profit target on a bullish trade.