The Materials sector is one of the more interesting sectors of the market, because it encompasses a pretty wide range of business types. It’s also an industry that the average consumer probably doesn’t think much about, I think primarily because as consumers we tend to be aware of just the finished goods and products that we use at any given time. Stocks in the Materials sector, however, are usually the companies that provide the components that manufacturers use to create the products and goods we consume. That’s where the diversity of business types comes into play: the sector includes paper manufacturers and wood processors to chemical companies producing everything from plastics to fertilizers and more.
For most of the past year, the pandemic has continued to rage around the world even as regional, national and global economies have worked to resume business activities. Limitations still exist, of course, because while the crisis extends into its third year, there are safety demands that limit capacity. The travel industry, while is heavily reliant on oil and fuel products, is a good example, and in a broader sense it also extends to just about any manufacturing operation, where companies have been forced to invest capital in redesigning and retooling their operations to comply with new distancing requirements, making factory and production spaces less economical.
Another interesting place to analyze the pandemic’s impact is on the demand for agricultural products like corn. Corn is a crop that is used for everything from the dinner on your plate to the production of ethanol, a fuel additive designed to make fuel consumption cleaner and more environmentally friendly. High corn demand also translates to high demand for nitrogen fertilizers. In 2020, favorable weather in the U.S. during the first quarter gave farmers an opportunity to start planting early, which then contributed to oversupply issues on this commodity that began with the collapse of demand at the beginning of the pandemic.
While that acted as a drag on companies in the Materials sector like CF Industries Holdings Inc (CF). This is a mid-cap producer of nitrogen and phosphate fertilizer. That makes them highly dependent on natural gas and ethanol, and subject to the variances in prices of those commodities. The stock struggled through 2020, but picked up a lot of bullish momentum in 2021, driving from a starting point in January of last year at around $40 to a high in late December at almost $75 per share. The stock’s move was in line with most stocks in this sector over the last year, and that is generally a good thing. Over the past month, the stock has fallen off of that $75 high point and appears to be picking up bearish momentum. Are the company’s fundamentals strong enough to suggest a new long-term opportunity could be emerging, and if so, where is the stock’s useful bargain price? Let’s find out.
Fundamental and Value Profile
CF Industries Holdings, Inc. manufactures and distributes nitrogen fertilizer, and other nitrogen products. The Company’s nitrogen fertilizer products are ammonia, granular urea, urea ammonium nitrate solution (UAN) and ammonium nitrate (AN). Its other nitrogen products include diesel exhaust fluid (DEF), urea liquor, nitric acid and aqua ammonia, which are sold primarily to the Company’s industrial customers, and compound fertilizer products (nitrogen, phosphorus and potassium or NPKs). The Company’s segments include ammonia, granular urea, UAN, AN and other. The Company’s ammonia segment produces anhydrous ammonia (ammonia), which is concentrated nitrogen fertilizer as it contains 82% nitrogen. The granular urea segment produces granular urea, which contains 46% nitrogen. The UAN segment produces urea ammonium nitrate solution. The Other segment includes DEF, urea liquor, nitric acid and NPKs. The Company’s primary nitrogen fertilizer products are ammonia, granular urea, UAN and AN.CF has a current market cap of about $13.8 billion.
Earnings and Sales Growth: Over the last twelve months, earnings increased by 838.5% (not a typo), while revenues were almost 61% higher. In the last quarter, earnings declined by about -15.8% while sales were -14.23% lower. The company’s margin profile is generally narrow, but has weakened considerably; Net Income as a percentage of Revenues in the last quarter is 5.86%, but fell to -12.11% over the last twelve months.
Free Cash Flow: CF’s free cash flow is $850 million. That translates to a Free Cash Flow of 8.35%.
Debt to Equity: CF’s debt to equity is .62, a conservative number that signals the company’s conservative approach to leverage. Their balance sheet shows cash and liquid assets were $757 million in the last quarter versus $3.4 billion in long-term debt. Their free cash flow, along with cash and liquid assets indicate that they have sufficient operating income to service their debt, however negative Net Income in the last quarter suggests these could be challenged in the quarters ahead.
Dividend: CF’s annual divided is $1.20 per share, which translates to a yield of about 1.87% at the stock’s current price.
Price/Book Ratio: there are a lot of ways to measure how much a stock should be worth; but I like to work with a combination of Price/Book and Price/Cash Flow analysis. Together, these measurements provide a long-term, fair value target around $42 per share. That means that at the stock’s current price, it is significantly overvalued, with about -34% downside from its current price, and a practical discount price at around $34.
Technical Profile
Here’s a look at the stock’s latest technical chart.
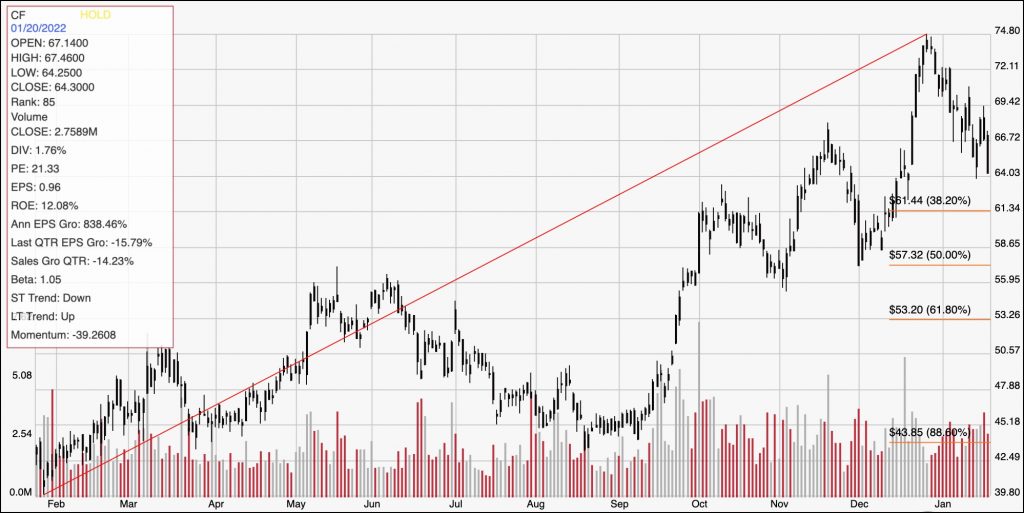
Current Price Action/Trends and Pivots: The diagonal red line traces the stock’s upward trend from January of last year to to its high point last month at around $75 per share. It also provides the baseline for the Fibonacci retracement levels shown on the right side of the chart. Since hitting its 52-week high about a month ago, the stock has picked up a lot of bearish momentum, recently breaking below support at around $67 to mark immediate resistance, with current supported expected at around $64, where the stock’s last pivot low occurred a few days ago. A push above $67 should have room to test next resistance anywhere between $72 and $75, while a drop below $64 should find next support at around $61, inline with the 38.2% retracement line.
Near-term Keys: CF’s fundamentals have generally held up well during the past two years, however I see the decline in earnings in the last quarter, with the dramatic turn to negative Net Income as a significant red flag. When you combine those concerns with the practical reality of the stock’s overvalued status, it’s easy to say that CF is a stock that needs to shed some weight before it becomes attractive again as a long-term investment opportunity. That also means that the best probabilities in working with this stock like in short-term, momentum-based strategies. A push above $67 could offer a useful signal to buy the stock or to work with call options, with a near-term price target at around $72 and $75 possible if buying activity increases. A drop below $64 would be a good signal to consider shorting the stock or working with put options, using $61 as an initial, quick-hit profit target on a bearish trade.