Market volatility looks set to stick around, with stock futures dropping after a wild Wall Street session that harked back to 2008, as the S&P 500 dug out of deep losses to close higher.
“At one point yesterday it felt like we were in a full-blown crisis let alone a recession,” noted Deutsche Bank strategist Jim Reid and his team. As JPMorgan reports, some individual investors threw in the towel on Monday, and ahead of a huge newsy week.
“The next three days have the potential to make or break the U.S. equity market,” Michael O’Rourke, chief market strategist at JonesTrading, told clients. “Tomorrow, Microsoft reports earnings after the close. Wednesday is the FOMC [Federal Open Market Committee] decision, or more precisely nondecision day, and on Thursday, Apple reports earnings.”
And don’t forget the brewing geopolitical troubles between the West and Russia over Ukraine.
With few expecting any move from the Federal Reserve this week, investors could face “six weeks of investor limbo as they await the policy tightening cycle to commence,” said O’Rourke. Still, by late Thursday, they may at least have more Fed and earnings clarity.
Our call of the day comes from a team of strategists led by Barry Bannister at Stifel. The strategists are calling Monday’s late rally a “head fake,” saying investors need five things to happen for stocks to bottom (they don’t see this happening before late first quarter 2022) and the bull market to resume, and none of them look viable right now.
One. A more dovish Fed, which would likely lower the 10-year Treasury Inflation-Protected Security real yield that has been pressuring growth stock price/earnings ratios. That’s unlikely before the markets get the first rate increase, says Stifel.
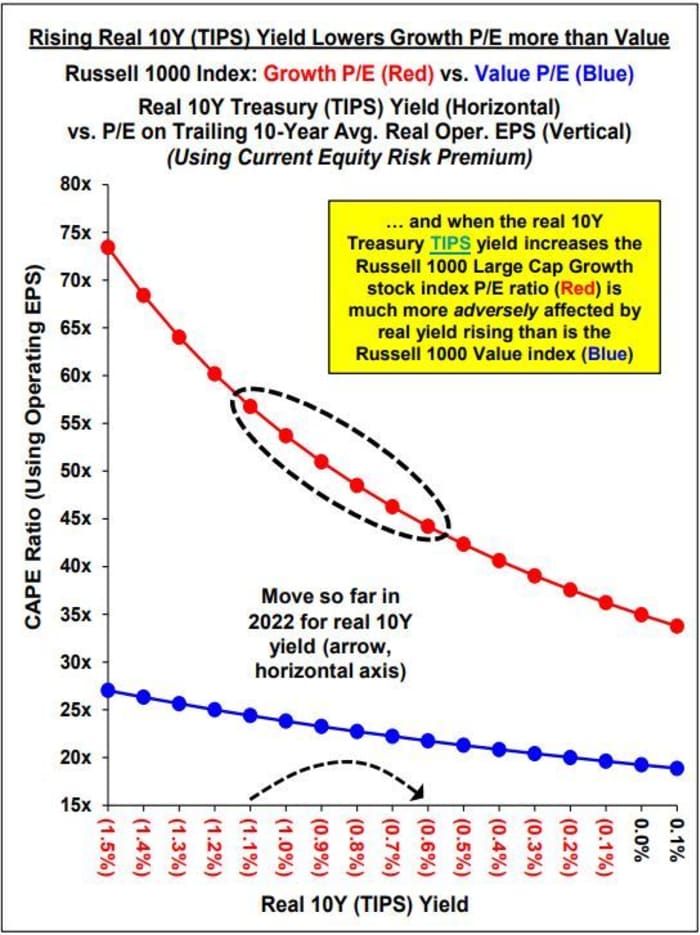
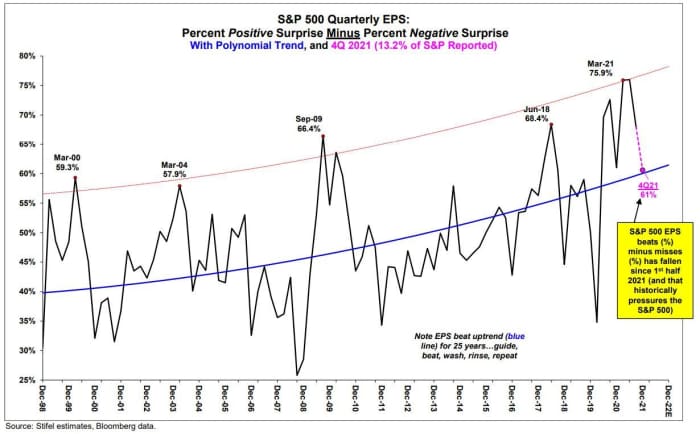
Bloomberg data, Stifel estimates.
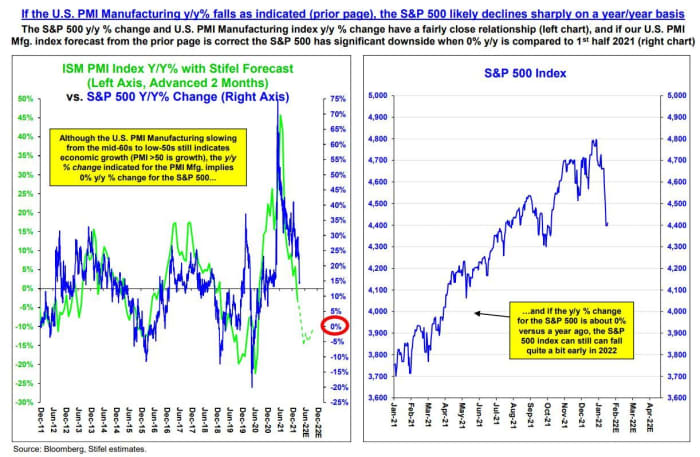
Two. The U.S. purchasing managers index for manufacturing index must bottom, which Stifel doesn’t see happening before April. Often, the annual PMI index change correlates with or leads year-to-year S&P 500 price, earnings per share and industrial production, they note.
Three. Global M2 money supply — that’s money held by the public — must bottom, and again this is unlikely until China’s currency weakens.
“China is 37% of global money supply in dollar terms and a weaker Chinese yuan would send the dollar up and growth in global money supply in dollar terms down, tightening U.S. financial conditions and lower the P/E ratio for the S&P 500,” says Bannister and the team. So the next “shoe to drop” is a weaker yuan.
Four. S&P 500 quarterly EPS “beats” minus “misses,” which have weakened since the second half of 2021 and have been pressuring stocks, need to calm down.
“When EPS beats minus misses are under pressure, in this case falling below the long-term trend (blue line), investors in the S&P 500 must learn to live with diminished policy support while also being subject to a lessening of the year/year change in S&P 500 price,” says Bannister and the team.
Five. That geopolitical mess to the East must be settled without hurting U.S. consumers.
“Ukraine events will matter: the West retaliating against a major global energy producer like Russia over possible Ukraine events may lead to a sharp decline in U.S. after-tax income after deducting household food & energy costs,” as shown in the below chart, says Bannister and the team.
And when that happens, the Senate and U.S. House of Representatives are usually lost for the party in power,” they add.
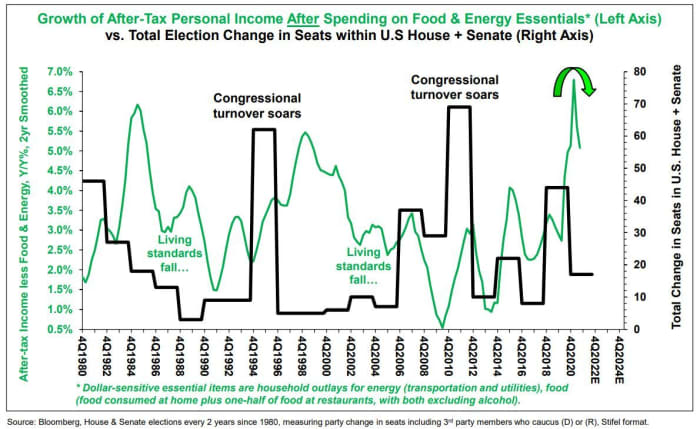
Russia has designs on eastern Ukraine only, and has the “nondollar reserves, power over EU energy flows, popular support in Russia and firepower to accomplish their goal of a USSR-style buffer zone separating them from the West,” adds Bannister.
Note, while Stifel have admitted it messed up with a summer 2021 correction call, in December it forecast the S&P 500 would hit 4,200 by the first quarter, recommending investors take shelter in defensives and clear out of cyclicals. It also warned that the Fed losing its nerve on rate increases could lead to “the third bubble in 100 years.” You can read that here, and it includes a list of stock recommendations.
Apart from the kickoff of the Fed meeting, November house prices from S&P Case-Shiller and the Federal Housing Finance Agency both showed some easing, following by a consumer confidence index for January. The IMF has cut its global growth forecast owing to weaker outlooks from China and the U.S.
The markets
The chart
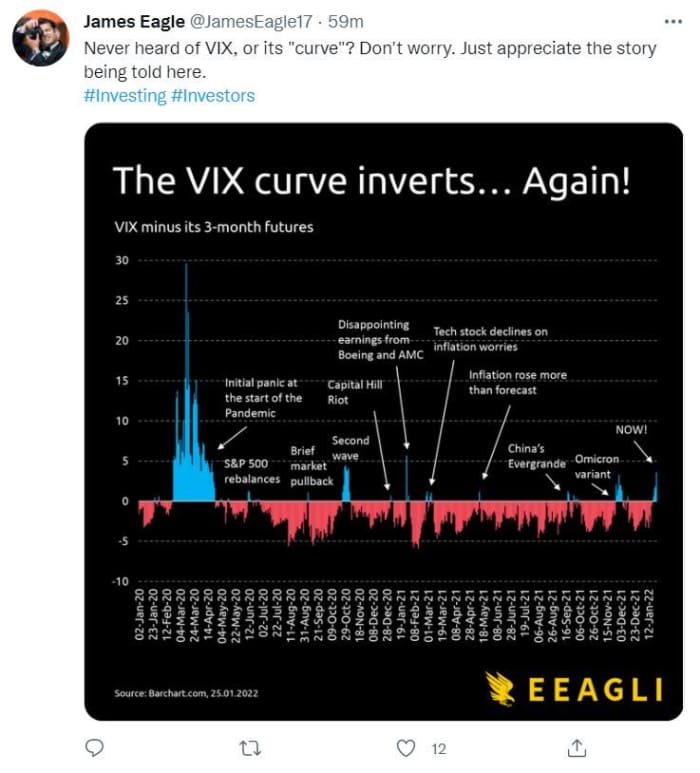
Here’s a look at the VIX, known as Wall Street’s fear gauge, and its “curve,” from financial blogger James Eagle (h/t @PriapusIQ):