One of the primary and most basic differences between growth and value investing lies in the way that the extreme ends of price swings are interpreted and used. For a growth-focused investor, seeing a stock at or near historical highs is a great thing, pointing to good signs of continued growth, since stocks tend to follow their longer trends. In the same way, a stock at or near historical lows is generally something that a growth investor will simply set aside to look for greener pastures.
For value seekers, the opposite generally tends to hold true. Given that all trends are finite, and will eventually reverse themselves, a stock at or near historical highs is something gives a bargain hunter pause, while stocks in the low end of their historical ranges makes them sit up and pay closer attention. The distinction between the two investing styles is one of the things that I think makes the stock market so interesting, because no matter what anybody says, one method is not categorically better, or is guaranteed to do better than the other in the long run. The suitability of one method over another really boils down to your own individual preference, and the additional steps and strategies you employ to manage the investments you make based on that method.
Since my focus is primarily on value, my natural inclination when I see a stock nearing historical highs is to assume that there isn’t much upside left, and that any additional increase in price is really based primarily on chance rather than on any useful, fundamentally-driven logic. I have also learned, however that nothing in the market is absolute, which is why I also try to leaven that assumption with a willingness to dive in to the same details I use for underperforming stocks to see if there might still be a useful value opportunity. Sometimes, a company’s underlying fundamental strength is such that even with the stock at or near previous highs, a reasonable fundamental argument can be made that there is value that the market hasn’t yet uncovered.
One of the interesting stories of the last two years is the way that the Consumer Discretionary sector has shown its resilience in the face of the pandemic, driven by a massive shift to e-commerce services and solutions. Among the shifts that worked in the favor of a lot of different industries in the sector, including stocks in the Textiles, Apparel & Luxury Goods industry has been an increased focus on personal health and wellness. That is an industry that includes well-known players like Under Armour (UA), Nike (NKE), Hanesbrands Inc (HBI) and today’s highlight, Gildan Activewear (GIL). GIL doesn’t have the same cachet that comes from immediate name recognition, but is a very interesting stock because of its focus on private label apparel.
An increasing number of retailers are shifting the products they offer, increasing shelf and floor space in favor of brands offered only in their own stores. One of GIL’s strategic goals is on partnering with traditional retailers to manufacture those private label goods. It’s a trend that is expected to continue to grow, since private labels offer higher margins in the always-competitive retailing industry where margins are consistently thin and becoming even narrower – and where traditional brands like NKE, UA and more have been actively working to develop their own direct-to-consumer systems to bypass the traditional, more costly retail arrangement. GIL is a stock that increased from about $26 a year ago to a high in November at around $44, and has mostly been consolidating since then in a range between $39 and $43. In the last couple of weeks, the stock has been picking up bullish momentum and is nearing the top end of its range. Is it ready to break out and keep moving higher? Are the company’s fundamentals strong enough to suggest it should keep moving higher? Let’s dig into the details and see for ourselves.
Fundamental and Value Profile
Gildan Activewear Inc. is a manufacturer and marketer of branded basic family apparel, including T-shirts, fleece, sport shirts, underwear, socks, hosiery and shapewear. The Company operates through two segments: Printwear and Branded Apparel. The Printwear segment designs, manufactures, sources, markets, and distributes undecorated activewear products. The Branded Apparel segment designs, manufactures, sources, markets, and distributes branded family apparel, which includes athletic, casual and dress socks, underwear, activewear, sheer hosiery, legwear, and shapewear products, which are sold to retailers in the United States and Canada. The Company sells its products under various brands, including the Gildan, Gold Toe, Anvil, Comfort Colors, American Apparel, Alstyle, Secret, Silks, Kushyfoot, Secret Silky, Therapy Plus, Peds, and MediPeds brands. The Company distributes its products in printwear markets in the United States, Canada, Mexico, Europe, Asia-Pacific and Latin America. GIL’s current market cap is $8.1 billion.
Earnings and Sales Growth: Over the last twelve months, earnings increased by 166.67% (not a typo), while revenues were a little over 33% higher. In the last quarter, earnings increased by 17.65%, while sales increased by 7.28%. GIL operates with a margin profile that suffered during the pandemic – which isn’t a big surprise given the conditions – but has shown significant signs of improvement over the past year. Over the last twelve months, Net Income as a percentage of Revenues was 17.7%, and increased in the last quarter to 23.49%.
Free Cash Flow: GIL’s free cash flow is a little more than $758 million, and translates to a useful Free Cash Flow Yield of 9.35%. The current number also marks an improvement over the past year from about $365 million, and $664 million in the previous quarter.
Dividend Yield: GIL’s dividend is $.616 per share, which translates to an annual yield of about 1.47% at the stock’s current price. Management suspended its dividend at the beginning of the pandemic, but reinstated it in 2021.
Debt to Equity: GIL has a debt/equity ratio of .35. This is a conservative number that generally implies management takes a careful approach to leverage. GIL’s balance sheet shows a little over $389 million in cash and liquid assets against about $600 million in long-term debt. GIL’s margin profile indicates operating profits are more than adequate to service their manageable debt load, with healthy liquidity to provide additional flexibility.
Price/Book Ratio: there are a lot of ways to measure how much a stock should be worth; but I like to work with a combination of Price/Book and Price/Cash Flow analysis. The “reopening” concept also provides a reasonable argument to factor expected growth rates into the equation, and I think that is applicable to GIL’s case. All together, these measurements provide a long-term, fair value target around $54 per share. That means that even with the stock’s increase in price over the last year, it remains nicely undervalued right now, with 29% upside from its current price. It is also worth mentioning that before the end of 2021, this same analysis yielded a long-term target price at $48.
Technical Profile
Here’s a look at the stock’s latest technical chart.
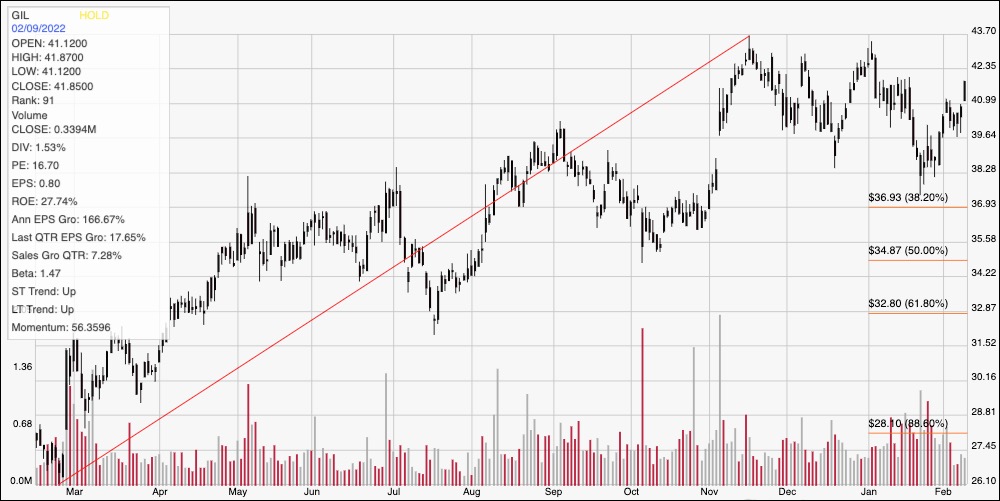
Current Price Action/Trends and Pivots: This chart traces the stock’s movement over the last year. The red line traces the stock’s upward trend since March of last year to its peak at around $44 in November; it also provides the baseline for the Fibonacci retracement lines shown on the right side of the chart. After reaching its high, the stock has settled into a consolidation range, with $43 providing immediate resistance, and current support sitting at around $40. A push above $43 will test the stock’s 52-week high at $44; if bullish momentum is strong enough, it could push to about $47 (based on the current distance between support and resistance) before finding next resistance. A drop below $40 should find next support at around $38.50, with additional support at around $37 where the 38.2% retracement sits if selling pressure increases.
Near-term Keys: If you’re looking for a short-term, bullish trade, look for a push above $44 as a good signal to buy the stock or to work with call options, with an eye on $47 as a useful exit target. If the stock shows weakness, and drops below support at $40, consider shorting the stock or working with put options, with $38.50 providing a good, initial profit target on a bearish trade. GIL is an interesting stock to pay attention to on a long-term basis; if market conditions and industry-specific trends continue to work in this stock’s favor, the long-term upside for this stock could be well above its 52-week high.