This week has seen the market pick up a lot of bearish momentum and increased volatility, but now the commentary and focus doesn’t center around economic indicators, COVID infection rates, or even about the spectre of increasing interest rates. Market commentary is now primarily dominated by headlines and information about Russia’s invasion of Ukraine and what the rest of the world is able to do to help counter that aggression.
Russia’s military buildup, and the likelihood it would be followed by an all-out invasion had already started to contribute to a host of issues that had the market dropping back into correction territory early this week; but the confirmation of the military action on Thursday sent every major market index gapping lower. Does that mean that the markets will continue to move lower, and perhaps even test bear market levels? Maybe; but at the very least, I think that the smart thing, no matter what your preferred investing style or method may be, is to be ready for continued volatility throughout the market.
One area that has remained resilient, but certainly not immune to broader pressures throughout the past two years is the Food Products industry. For most of 2021, stocks in this industry not only kept pace with the market, but in many cases outperformed the sexier, growth-driven industries and names. Diving into the fundamentals of many of these companies have shown balance sheets that continue to weather the pandemic storm better than most other industries did in 2020, and in a number of cases have managed to improve even more since then. That increasing fundamental strength has been a big driver in stock price performance, but even with significant moves higher, in many cases the fundamental strength has also grown enough to keep the value proposition attractive.
Indications in late 2021, and into the start of this year have demonstrated the effect of rising costs of goods for these companies that have begun rippling into consumer price levels, which is a headwind that may not be resolved in the near future, as supply chains remain constrained. These are pronounced in many cases by persistent labor shortages that limit capacity and productivity. That means that while the Food Products industry is likely to continue to see healthy demand, how much it is able to rise to meet demand remains an open question.
Tyson Foods Inc. (TSN), is a stock I’ve followed for some time. 2020 wasn’t good for the stock; from a January peak at around $94, the stock began a downward slide that only accelerated in March as the entire stock market moved into bear market territory. TSN did find a bottom at around $44 with the rest of the market, and by the end of 2020, the stock was sitting at around $62.50. 2021 has seen the stock extend its long-term upward trend even more, hitting a 52-week high earlier this month at around $100. Broad market uncertainty since then pushed the stock down to about $90 yesterday, with the stock now recovering a bit a sitting a little below $92 as of this writing.
The company has invested heavily since early 2020 to address safety concerns, and that is something that in the early stage of the health crisis acted as a drag on the bottom line; but the company’s most recent earnings reports suggest not only that it continues to navigate those short-term, coronavirus-driven headwinds, but that it has benefited from increases in protein demand in the U.S. and overseas. An epidemic of African Swine Flu in 2018 ravaged the domestic hog population in China, the world’s largest pork producer and exporter, leaving a long-term protein shortage in that part of the world that is expected to continue for years to come, and puts U.S. protein producers like TSN in a position of strength. Compared against the stock’s upward trend, does that mean the stock is priced too high for effective value, or has the latest dip opened up the possibility for a reasonable value-driven opportunity?
Fundamental and Value Profile
Tyson Foods, Inc. is a food company, which is engaged in offering chicken, beef and pork, as well as prepared foods. The Company offers food products under Tyson, Jimmy Dean, Hillshire Farm, Sara Lee, Ball Park, Wright, Aidells and State Fair brands. The Company operates through four segments: Chicken, Beef, Pork and Prepared Foods. It operates a vertically integrated chicken production process, which consists of breeding stock, contract growers, feed production, processing, further-processing, marketing and transportation of chicken and related allied products, including animal and pet food ingredients. Through its subsidiary, Cobb-Vantress, Inc. (Cobb), the Company is engaged in supplying poultry breeding stock across the world. It produces a range of fresh, frozen and refrigerated food products. Its products are marketed and sold by its sales staff to grocery retailers, grocery wholesalers, meat distributors, warehouse club stores and military commissaries, among others. TSN has a current market cap of $32.7 billion.
Earnings and Sales Growth: Over the last twelve months, earnings increased almost 48%, while sales increased 23.64%. In the last quarter, earnings were nearly 25% higher while sales were only about 1% higher. TSN traditionally operates with a modest margin profile, but that has seen useful increases over the past year and the last quarter;; in the last twelve months, Net Income was 7.47% of Revenues, but increased to 8.67% in the last quarter.
Free Cash Flow: TSN’s Free Cash Flow is healthy, at a little more than $2.55 billion. That number has increased from about $1.6 billion at the beginning of 2020, but dipped from about $2.8 billion a year ago, and $2.6 billion in the quarter prior. Its current level translates to a Free Cash Flow yield of 7.65%.
Debt to Equity: TSN has a debt/equity ratio of .45, which is conservative. Cash and liquid assets were about $437 million at the end of 2019, increased to $2.4 billion at the end of 2020, and were just a little under $3 billion in the last quarter. TSN carries about $8.3 billion in long-term debt. The company’s operating profile indicates there should be no problem servicing debt, with the company demonstrating the ability to navigate cyclical and economic challenges successfully from quarter to quarter as they come.
Dividend: TSN increased its annual dividend from $1.68 per share to $1.78 per share in 2020, and again to $1.84 per share late last year. That new number translates to a dividend yield of 2.04% at the stock’s current price. TSN’s dividend has also increased from $1.20 per share in late 2018, and $1.52 at the end of 2019. The fact that management not only maintained the higher dividend, but increased it during the pandemic despite the early challenges it had to deal with in adjusting to pandemic-driven operating conditions is noteworthy since so many other companies were forced to reduce or suspend their dividends during the same period.
Price/Book Ratio: there are a lot of ways to measure how much a stock should be worth; but I like to work with a combination of Price/Book and Price/Cash Flow analysis. Together, these measurements provide a long-term, fair value target around $105.50 per share. That means that even with the stock’s sizable increase this year, it still offers an interesting bargain proposition, with 17% upside from its current price, and a compelling discount price at around $84 per share.
Technical Profile
Here’s a look at the stock’s latest technical chart.
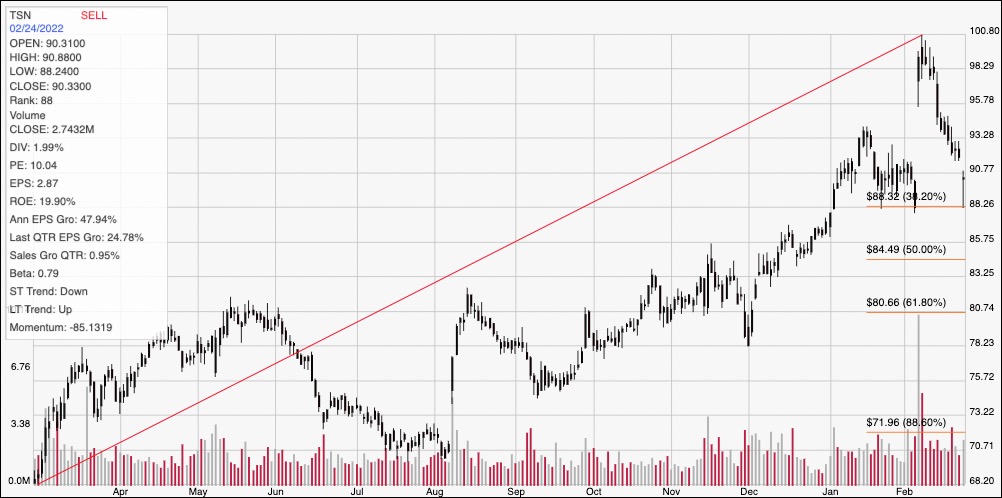
Current Price Action/Trends and Pivots: The diagonal red line outlines the stock’s upward trend over the past year beginning at around $68 and tracing to its high earlier this month at around $101. It also provides the baseline for the Fibonacci retracement lines shown on the right side of the chart. The stock has picked up a lot of bearish momentum, but also saw a sizable swing from its low point yesterday at around $88 per share and rallied into the close to finish about where it started. That could be a solid support bounce that may be setting up another “buy the dip” kind of opportunity that has been provided at multiple points in the last year along its upward trend.Immediate resistance for the stock is now right around $93 per share based on pivot high activity seen in January. A drop below current support at $88 could see the stock drop to about $84.50, where the 50% retracement line is sitting, while a push above $93 could give the stock momentum to push all the way to its 52-week high at around $101 before finding new resistance.
Near-term Keys: TSN’s value proposition is interesting, even with the stock’s long upward trend, with the current pullback looking like an interesting new buying opportunity within the longer upward trend. If you prefer to work with short-term term trading strategies, you could also use a push above $93 as a signal to buy the stock or work with call options, with a useful profit target around $101 if bullish momentum accelerates. A drop below $88 could offer a signal to consider shorting the stock or buying put options, using $84.50 as a first, quick-hit profit target on a bearish trade.