To say that in 2022, the market has been rocky is certainly an understatement. Fears of inflation and interest rate increases quickly gave way to rising oil prices and the now-ongoing conflict in Ukraine that seems unlikely to see a quick or peaceful end. All of it together has created a pretty constant state of uncertainty, and elevated volatility in the stock market. As of yesterday’s close, the Nasdaq has entered bear market lows, while the Dow and the S&P 500 are higher, but still well into correction ranges. With a lot of questions about the global economic and political impact of war, how far it may extend and how long it will last anything but clear, it seems that uncertainty and volatility are going to continue to be prime descriptions for market conditions.
Economic uncertainty usually suggests that cyclically-sensitive industries are the most exposed to downside risk. One of the industries that certainly fits that general description is the Auto industry. As measured by the Nasdaq Global Auto Index ETF (CARZ), this is an industry that has dropped almost -24% since late November.
That drop comes in the face of indications late in 2021 that throughout the year just about every auto brand sold in the U.S. had seen healthy increases that were broadly expected to continue in 2022. Economic sanctions on Russia, to say nothing of the massive spike in oil prices since the war began could well put those forecasts in doubt, which means the entire industry could be challenged through the rest of the year.
MGA is a Canadian company whose biggest customers include the Detroit Big Three automakers and German brands Daimler, BMW and Volkswagen. And while they’ve taken their lumps with the rest of the industry and the market, their balance sheet has been impressively resilient. They are also among the few companies in the industry that managed to maintain their dividend payout throughout the pandemic, and in fact raised their dividend payout following their most recent earnings report. They also have enough of a presence in the electrical vehicle (EV) market to see positive impacts from that continued, emerging auto trend.
The stock enjoyed a massive run up in price from its March 2020 low at around $23 to a high in June of 2021 above $104. From that point, the stock has dropped back almost -41% to its current price around $60 per share, with about half of that drop coming in just the last couple of weeks. The question, of course, is whether their overall fundamental strength, with that attractive dividend, and the stock’s drop back is enough to also make the stock a good value, or is broad market risk right now so high that it would be better to stay away? Here are the numbers.
Fundamental and Value Profile
Magna International Inc. (Magna) is a mobility technology company. The Company’s segments include Body Exteriors & Structures, Power & Vision, Seating System and Complete Vehicles. Its product capabilities include body, chassis, exterior, seating, powertrain, active driver assistance, electronics, mirrors & lighting, mechatronics and roof systems. Its products include sealing systems, sliding folding and modular roofs, active aerodynamics, lightweight composites, fuel systems, engineered glass, body systems, electronic controllers, interior mirrors, exterior mirrors, tail lamps, small lighting, seat structures, door systems, power closure systems, mechanism & hardware solutions, foam & trim products, complete vehicle manufacturing, engineering services and fuel systems. MGA has a current market cap of about $17.9 billion.
Earnings and Sales Growth: Over the last twelve months, earnings declined -54%; Revenues also dropped by -13.8%. In the last quarter, earnings increased by 132%, while sales were 15% higher. MGA’s operating profile has historically been narrow, and in 2021 had shown signs of deterioration, however the last quarter shows that profitability is improving. In the last quarter; Net Income versus Revenues was 5.09%, versus 4.18% over the last twelve months.
Free Cash Flow: MGA’s free cash flow is healthy, at almost $1.5 billion. This number has been has declined over the last couple of quarters, as shown by the fact Free Cash Flow was $2.5 billion in the quarter prior and $3.9 billion three quarters ago. The current number translates to an attractive Free Cash Flow Yield of about 9.25%.
Dividend: MGA pays an annual dividend of $1.80 per share, which translates to an annual yield of 3.16% at the stock’s current price. The company has also increased the dividend from $1.32 per share, per year steadily since late 2018, and which includes an increase from $1.60 per share at the beginning of 2021. An increasing dividend is a strong indication of management’s confidence in their business and long-term strategy.
Price/Book Ratio: there are a lot of ways to measure how much a stock should be worth; but I like to work with a combination of Price/Book and Price/Cash Flow analysis. Together, these measurements provide a long-term, fair value target around $64 per share. That suggests that MGA is undervalued by 12% from its current price, with a practical discount price at around $51.
Technical Profile
Here’s a look at the stock’s latest technical chart.
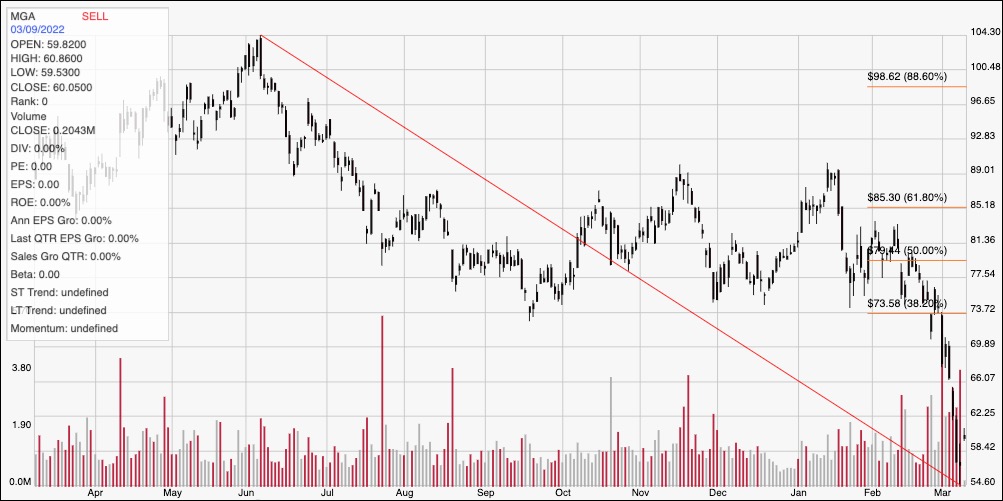
Current Price Action/Trends and Pivots: The chart above displays the stock’s price activity over the past year. The red diagonal line traces the stock’s downward trend from June of last year to its low this week around $54.50. It also provides the basis for the Fibonacci retracement lines on the right side of the chart. The stock is moving higher today, which suggests that current support is around $57 per share using Monday’s close and Tuesday’s opening and closing prices around the same level. Considering the speed of the stock’s drop from around $77 to that low point, I would analyze that plunge in the same way I would an overnight gap; technical analysis suggests that most gaps tend to fill themselves by about half of the size of the gap. That would put immediate resistance in the $65 range. A drop below $57 should see the stock test its recent low point around $54.50. There is also strong support in that price area from previous pivot activity in 2019 and 2020 to further bolster that number as current support. If that support fails, the stock could fall to about $50. A push above $65 should give the stock room to rally to about $75, which is the low point for most of the stock’s range through the of 2021 and the first part of this year.
Near-term Keys: If you’re looking for a short-term bullish trading setup, and you don’t mind being very aggressive, the stock’s latest bounce off support at around $57 could be a good signal to buy the stock or work with call options, with an eye on $65 as a practical bullish profit target. A push below $57 would act as a signal to short the stock or to consider buying put options, with a bearish profit target at around $54.50, and $50 possible if bearish momentum accelerates. MGA offers an interesting, but not quite compelling discount at its current price, and given the current pace of bearish momentum and broad market uncertainty, I think it might make sense to wait to see if the stock retests its recent low to offer a more impressive opportunity to buy the stock at its current price.