Any experienced investor, no matter what their investment philosophy is, will undoubtedly tell you that one of the most useful ways they keep track of new opportunities as they come up is by maintaining a watchlist of stocks that they can check on a regular basis. A good, diversified list of stocks in a variety of different industries can be an effective way to keep your investing functional, no matter what the ebb and flow of market sentiment is doing at any given time, since as one industry may be moving out of favor with investors, another will undoubtedly be moving into favor.
2022 has kept a lot of people a on edge about the health of the global economy has come into question. Inflationary indicators have led to rising interest rates, which have also been compounded by the effect of coordinated economic sanctions by the Western world against Russia from its invasion of Ukraine. That conflict continues to feed uncertainty, since reports from either side have been difficult to impossible to confirm on an independent basis, and of course questions of how long it will extend, and what the final outcome will be, remain in flux.
One of the challenges comes at the point when market uncertainty and fear leads to mounting selling pressure – enough that the market begins to turn from bad to worse. The early part of the year saw enough fear to prompt the NASDAQ 100 to fall below the -20% mark that most analysts and experts use to define the start of a bear market. The Dow Jones Industrial Average and S&P 500 didn’t cover quite the same distance, but still feel well past correction benchmarks, which was enough to put have some talking heads calling from a brand new recession and long-term bear market.
Of course, in the last couple of weeks of this month, the market has largely rebounded from those lows, which I take as a validation of the “sell the rumor, buy the news” effect that often has the market reacting on the anticipation of bad news before it happens, and then self-correcting. Does that mean the worst is over? I’m not sure, because there are still plenty of concerns about inflation, supply chain issues that still span multiple segments of the economy, and the long-term impact the crisis in Ukraine will have on energy prices (no matter how or when that conflict finds an endpoint). I think that means that it’s hard to paint to categorically bullish picture for the future, but I also hesitate to turn completely bearish. I think the smart thing for an average investor is to remain cautious, selective and conservative about when to take on new investments, and how much of your capital you decide to allocate to those positions as they come.
The market’s drop through the start of the year until the middle of this month saw a number of stocks fall into their own respective bear market pricing levels, off of previous highs. That includes stocks like Eastman Chemical Co. (EMN), one of the biggest companies in the Chemicals industry. The stock hit a high point in January at around $128 before following the market to a March low point at around $105. That was a drop of about -19% – not quite enough for a technical bear market in the stock, but enough to make the drop interesting to value hunter, who have since given the stock enough bullish momentum to rally to its current price a little below $114.
While most companies is just about every sector have seen a material impact over the last two years from COVID-19, EMN has actually shown strength throughout the time period, which is a big reason the stock more than quadrupled in value from its March 2020 low a little above $30 per share. The real question now, of course is whether the company’s fundamentals have kept up with that increase, and if so, does the stock’s current price offer a useful value now? Let’s find out.
Fundamental and Value Profile
Eastman Chemical Company (Eastman) is an advanced materials and specialty additives company. The Company’s segments include Additives & Functional Products (AFP), Advanced Materials (AM), Chemical Intermediates (CI), and Fibers. In the AFP segment, it manufactures chemicals for products in the coatings, tires, consumables, building and construction, industrial applications, including solar energy markets, animal nutrition, care chemicals, crop protection, and energy markets. In the AM segment, it produces and markets its polymers, films, and plastics with differentiated performance properties for end uses in transportation, consumables, building and construction, durable goods, and health and wellness products. The CI segment leverages large scale and vertical integration from the cellulose and acetyl, olefins, and alkylamines streams to support its specialty operating segments. Its product lines in Fibers segment include Acetate Tow, Acetate Yarn and Acetyl Chemical Products. EMN’s current market cap is $14.7 billion.
Earnings and Sales Growth: Over the last twelve months, earnings increased a little more than 7% while revenues were about 23.25% higher. In the last quarter, earnings declined nearly -26.5% while sales declined by about -1%. The company’s margin profile is showing significant signs of improvement that I think reflect the company’s intentional positioning in defensive-oriented sectors like Consumer Staples. Net Income for the last twelve months was a healthy 8.18% of Revenues, and rose to 14.03% in the most recent quarter.
Free Cash Flow: EMN’s free cash flow is healthy, at $1.04 million. This is a number that has increased significantly since 2017, from about $650 million, and been pretty stable over the past year, dropping only slightly from $1.12 billion a year ago. It also translates to a Free Cash Flow yield of about 7%.
Debt to Equity: EMN has a debt/equity ratio of .76, implying a generally conservative approach to debt management. The company’s balance sheet indicates their operating profits are more than adequate to service their debt for the time being, with increasing Net Income a good reflection of their improving financial flexibility. Their balance sheet shows $459 million in cash and liquid assets (a decline from $717 million a quarter ago) versus about $4.4 billion in long-term debt. I think it also noteworthy that EMN has decreased their debt from $5.4 billion in 2020 at the height of the pandemic.
Dividend: EMN pays an annual dividend of $3.04 per share, which translates to a yield of about 2.66% at the stock’s current price. It should also be noted that management increased their dividend payout from $2.64 per share two quarters ago to its current level, which is an additional sign of confidence in their business model moving forward.
Price/Book Ratio: there are a lot of ways to measure how much a stock should be worth; but I like to work with a combination of Price/Book and Price/Cash Flow analysis. Together, these measurements provide a long-term, fair value target at around $85 per share. That means the stock is overvalued, with -25% downside from the stock’s current price, with a practical discount price at around $68 per share.
Technical Profile
Here’s a look at the stock’s latest technical chart.
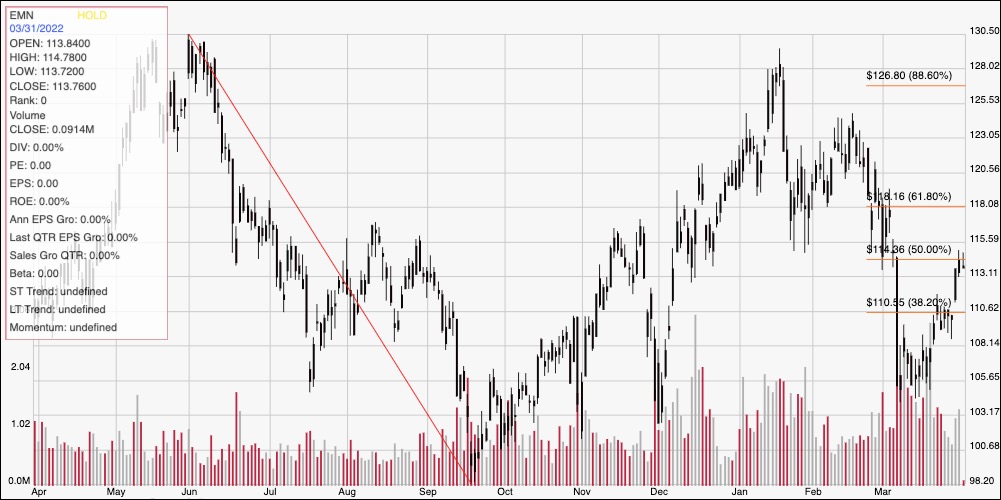
Current Price Action/Trends and Pivots: The diagonal red line traces the stock’s downward trend from $130.50 in June of last year to its low in September; it also provides the reference for calculating the Fibonacci retracement levels indicated by the horizontal red lines on the right side of the chart. After reaching a new, lower peak at around $128, the stock fell back again to finally find strong support at around $105.50. This week the stock has pushed above the 38.2% retracement at around $110 to mark current support at that point, but a little below the 50% retracement line at around $115, which we’ll use for immediate resistance. A push above $115 should have room for the stock to rally to about $118, where the 61.8% retracement line waits. A drop below $110 should revisit the stock’s recent low at around $105.
Near-term Keys: There really is no way right now, despite EMN’s fundamental strengths and attractive dividend, to also call the stock a useful value; the stock would need to fall to about $68 before a practical, useful discount would really be available. If you prefer to work with short-term strategies, I would pay close attention to the stock’s current support and resistance levels. A push above $115 could offer a decent signal to consider buying the stock or working with call options, with $118 acting as a practical, quick-hit profit target on a bullish trade. A drop below $110 would be a good signal to this about shorting the stock or buying put options, with the stock’s recent support at around $105 acting as a good profit target on a bearish trade.