Over the years of my investing career, I have learned that thinking of myself as a lifelong learner has been a good way to stay open not only to investing opportunities that fit my preferred investing style, but also to finding new ways to adapt as the market continues its never-ending process of evolution. Even so, I often find myself gravitating back to familiar, time-proven methods. It’s one of the reasons that value investing has become, and continues to be the primary tool I use to reach my investing objectives and goals. It also means that some of the simple methods for finding new investments I learned long ago, at the beginning of my career still find a place in my approach to surveying and analyzing the market for new opportunities.
One of those methods came from a book that I was required to read when I began my career in the brokerage industry nearly thirty years ago. One Up on Wall Street is a book written by Peter Lynch, a man who made his career, and his fortune as the fund manager of Fidelity’s Magellan fund in the 1980’s. The fund outperformed every major index during the years under his stewardship and became not only the largest mutual fund in the industry at the time, but also the benchmark against which every other fund was measured.
His book outlined the approach he used as a fund manager as well as in his personal investments. When I read it, I was struck by the simple approach he took to start his analysis. He’d look around his house, his office, etc., and identify the goods and services he made frequent use of, and then he’d look up the company that produced them. It made sense – if you frequently consume Coca-Cola, for example, thinking about investing in the company you are producing revenue for as a consumer should be a no-brainer. It sounds obvious, but it’s actually something that most average investors, including me, don’t think about doing when we get started and we’re trying to sort through the more than ten thousand publicly traded companies on U.S. exchanges.
I was reminded of Mr. Lynch’s approach this week when some of the screeners I use to filter the market brought up a stock that I’ve known for more than thirty years, and whose products I’ve kept in my home for a large chunk of that time. La-Z-Boy Inc. (LZB) doesn’t get a lot of attention from market pundits and analysts, perhaps because the company is a small-cap stock; but if you’ve ever compared rockers and recliners you might want to put in your home, I’m willing to bet that a La-Z-Boy chair was near the top of your preferred list. For my family, a La-Z-Boy recliner is a must-have, and has been for more than twenty years. Finding this stock in my screening list this week made me smile and say hello to an old friend.
LZB is a company with an interesting set of fundamental strengths, characterized first by zero debt and a useful dividend at the stock’s current price. The stock’s price performance over the last year has been unimpressive, as its has followed a downward trend from a peak in May of last year at around $47 to its current price at around $26. Supply chain constraints that have characterized a number of industries throughout the past year and increased costs are certainly a factor in the company’s fundamental performance over the last year, and I believe that has been reflected in the stock’s price performance. That begs the question, however of where the stock’s useful value price actually lies? Has the stock’s downward trend forced the price low enough that it could offer a useful value right now? Let’s dive in.
Fundamental and Value Profile
La-Z-Boy Incorporated is a producer of reclining chairs and the manufacturer/distributor of residential furniture in the United States. The Company’s segments include Wholesale segment, Retail segment and Corporate and Other. The Wholesale segment consists of three brands: American Drew, Hammary, and Kincaid, which manufactures, and imports upholstered furniture, such as recliners and motion furniture, sofas, loveseats, chairs, sectionals, modulars, ottomans and sleeper sofas and imports casegoods (wood) furniture, such as occasional pieces, bedroom sets, dining room sets and entertainment centers. Its Retail segment consists of approximately 159 Company-owned La-Z-Boy Furniture Galleries stores. The Retail segment primarily sells upholstered furniture, in addition to some casegoods and other accessories, to the end consumer through these stores. Its Corporate and Other includes Joybird, an e-commerce retailer that manufactures upholstered furniture. LZB has a current market cap of $1.1 billion.
Earnings and Sales Growth: Over the past year, earnings by -12.16%, while sales increased by 21.56%. In the last quarter, earnings we were about -23.53% lower, while sales also declined by -0.75%. The company operates with a narrow margin profile that appears to be shrinking; over the last twelve months, Net Income was 5.93% of Revenues, and narrowed to 4.98% in the last quarter. While a significant portion of the earnings and net income pattern just described can be attributed to supply issues and cost increases that are out of the company’s control, the question remains how long these challenges are likely to persist, which makes watching these metrics in the quarters ahead increasingly important.
Free Cash Flow: LZB’s Free Cash Flow was $41.97 million in the last quarter. On a Free Cash Flow Yield basis, that translates to a modest 3.71%. A year ago, Free Cash Flow was $274.73 million, marking a significant decline over the year and raising another warning flag that confirm the pattern described by earnings and net income.
Debt to Equity: LZB has a debt/equity ratio of 0, which reflects the reality that the company carries zero long-term debt on their balance sheet. They also have about $240 million in cash and liquid assets on hand, which for now means that the company is a good financial position, even with the challenges described by their net income and free cash flow patterns. Even so, two quarters ago cash and liquid assets were $336.23 million, showing that the company is absorbing declines across the board that can only last so long.
Dividend: LZB pays a dividend of $.66 per share, and which translates to an annual yield of about 2.52% at the stock’s current price. I think that it is also noteworthy that the company maintained its dividend throughout the past two years; that is remarkable not only for a company that is largely reliant on consumer discretionary spending, but even more so for a small-cap stock. They have also raised their dividend three times after reducing (but not eliminating it) for one quarter in 2020, with the latest increase coming at the end of 2021. An increasing dividend is a strong indication of management confidence.
Price/Book Ratio: there are a lot of ways to measure how much a stock should be worth; but I like to worth with a combination of Price/Book and Price/Cash Flow analysis. Together, these measurements provide a long-term target at about $19 per share. That suggests that LZB’s stock is overvalued at its current price, with about -28% downside, and a practical discount price at around $15 per share.
Technical Profile
Here’s a look at the stock’s latest technical chart.
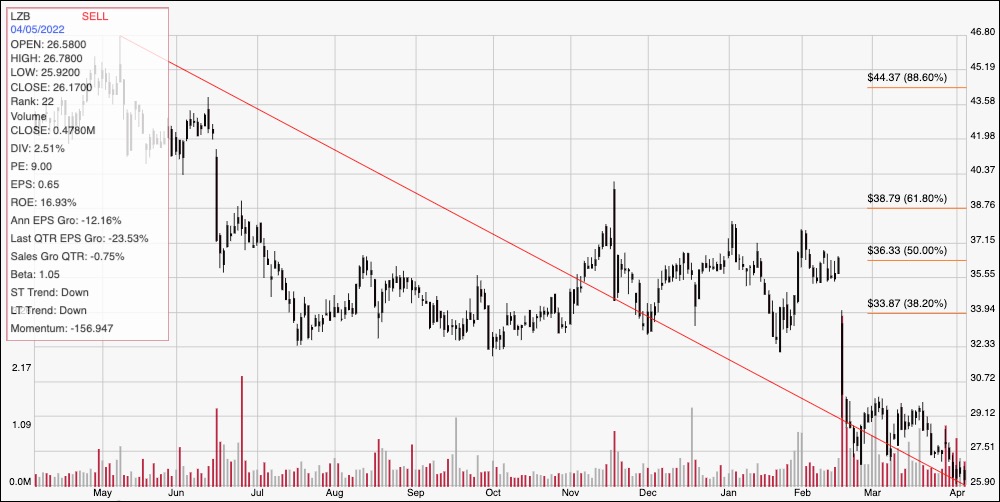
Current Price Action/Trends and Pivots: The chart above traces the last year of price activity for LZB. The red diagonal line traces the stock’s downward trend from a high in May 2021 at around $47 to its recent low this month at around $26. It also provides the baseline for the Fibonacci retracement lines shown on the right side of the chart. The stock has reached its 52-week low this week, and appears to have dropped out of a temporary consolidation range from late February to mid-March between $27.50 and $29.50. That $2 distance suggests that, with immediate resistance now at $27.50 (previous support becomes new resistance) current support should be at around $25.50. A drop below that point, however could have additional downside to about $23.50, while a push above $27.50 will find next resistance at around $29.50. The stock would actually need to push above the 38.2% retracement line to mark a reversal of its long-term downward trend, which means the stock would have to push to about $34.
Near-term Keys: LBZ is a company with an interesting fundamental profile; but the current pattern of declining Net Income, Free Cash Flow, and Cash is a concern that I think supports the fact the stock does NOT offer a useful value opportunity right now. I do think that is a reflection of broader challenges management cannot control; but that is also why I think watching the quarters ahead before thinking about taking a long-term position in the stock is the right idea for now. If you prefer short-term trading strategies, a pivot and move upward off of $25.50 could be a signal to think about buying the stock or working with call options, so long as you keep an eye on $27.50 as a quick profit target, and $29.50 in the event that buying momentum accelerates. A drop below $25.50 could be a signal to consider shorting the stock or buying put options, with $23.50 offering a practical, near-term profit target on a bearish trade.