One of the things that makes the markets interesting to me is the way that history often informs – even though it doesn’t necessarily predict – current market activity. The fact that previous lows often help the market to find new lows, and previous highs often lead to current highs, for example, lends credence to the technical principle that previous price activity can act as a guide for future price action. It is one of the primary tenets that makes the chart patterns that inform technical analysis possible.
Despite the fact that previous price activity does, in fact, often help to identify likely future levels of price action, it is also true that, from year to year, every market has a way of finding its own thread or theme.
That’s another aspect of the economy and the market that I find fascinating, is trying to find the thread, or set of threads that can be tied to together to create a commentary about market activity over a specific range of time. Where price activity can often be considered a “microeconomic” method of analysis, looking for the broad market’s connective threads over time tends to work on a higher, “macroeconomic” level.
2022 has so far, in large part been influenced by factors on a larger stage than just a single industry or sector. Global, macroeconomic factors like heightened political tensions between the West and Russia from its unprovoked attack on Ukraine, and accelerating inflation in the U.S. fueled in part by global supply chain challenges that are still being influenced by the pandemic that we all wish, but still cannot fully put in our rear view are just a few examples. These elements have all had their way so far and continue to keep pressure on the market. That puts a big onus on individual investors to be aware of not just these issues but also their impact on the industries and stocks they are interested in.
Cyclical stocks are those that are expected to do well when economic conditions are generally healthy, and that will naturally struggle when the economy struggles. One of the core sectors of the economy that fits this very generalized description is the Transportation sector, which takes in a broad set of industries, including airlines, railroads, trucking and freight, overseas shipping, and so on.
Uncertainty and volatility amid signs that the economy is struggling means that you can often find stocks in these industries trading at pretty significant discounts to their not-so-distant highs. That makes them tempting fodder for a contrarian, value-oriented investor. I like to pay attention to these stocks, because their fundamentals can give me some useful clues about their ability to weather an economic downturn. These are also stocks that, like any other, can see big swings from high to low based on nothing more than the market’s expectation for what the economy might do in the near future.
CSX Corporation (CSX) is a good example of the kind of stock I’m referring to. As one of the four largest transportation companies in the oligopoly that is the Road & Rail industry, this is a stock that is very sensitive to a variety of economic dynamics, from commodity and fuel prices to interest rate fluctuations. The collapse of oil prices during the pandemic might have been taken as a good thing for this sector, since fuel costs should generally be lower; but as economy activity ground to a halt during the second quarter of 2020, so too did the demand for transportation services.
From a bear market bottom in March of 2020, the stock rebounded like most of the rest of the market as investors acted on the hope that the net economic effect would be temporary; in fact, the stock used the market’s broad, forward-looking and bullish hope of a recovery as a reason to push the stock from around $22 in July 2020 to a peak in early May of 2021 at around $35. From that point, the stock dropped back to a short-term low at around $30 in late September. Since then, the stock peaked at the start of January at around $39, but has settled into a trading range between about $34 and $38 since then.
Cyclical stocks like CSX are sensitive to the kind of pressures and dynamics I’ve just outlined, which is why it becomes important to take a critical look at the company’s balance sheet and overall fundamental strength. This is a company with a strong fundamental profile, and a balance sheet that has weathered the pandemic storm remarkably well. That is a positive sign that bodes well for the company in the long-term, but another question we have to answer is whether the stock’s current trading price represents a compelling enough value under current market conditions to justify taking its long-term opportunity seriously. Let’s dive in.
Fundamental and Value Profile
CSX Corporation is a transportation company. The Company provides rail-based freight transportation services, including traditional rail service and transport of intermodal containers and trailers, as well as other transportation services, such as rail-to-truck transfers and bulk commodity operations. The Company categorizes its products into three primary lines of business: merchandise, intermodal and coal. The Company’s intermodal business links customers to railroads through trucks and terminals. The Company’s merchandise business consists of shipments in markets, such as agricultural and food products, fertilizers, chemicals, automotive, metals and equipment, minerals and forest products. The Company’s coal business transports domestic coal, coke and iron ore to electricity-generating power plants, steel manufacturers and industrial plants, as well as export coal to deep-water port facilities. CSX has a current market cap of $75.6 billion.
Earnings and Sales Growth: Over the last twelve months, earnings increased by almost 26%, while sales increased 21.3%. In the last quarter, earnings declined by -7.14% while sales were were flat, but slightly negative at -0.41%. CSX operates with a healthy, robust margin profile that has been remarkably resilient, but also matches its current declining earnings pattern; in the last twelve months, Net Income was about 30% of Revenues, but weakened to 25% in the last quarter.
Free Cash Flow: CSX’ Free Cash Flow is healthy and growing, at more $3.8 billion. That marks an improvement from about $3.1 billion a year ago. Their current Free Cash Flow number translates to a Free Cash Flow Yield of 5.24%.
Debt to Equity: CSX has a debt/equity ratio of 1.21. This indicates the company is highly leveraged; but this is also very typical of stocks in the Transportation industry. Their balance sheet shows they have about $2 billion in cash and liquid assets against roughly $16 billion in long-term debt as of the most recent quarter. Liquidity has declined, from about $2.3 billion in the quarter prior, which follows both the current Net Income pattern. Despite those concerns, the company’s operating profile suggests there should be no problem servicing the debt they carry.
Dividend: CSX pays an annual dividend of $.40 per share, which at its current price translates to a dividend yield of about 1.17%. It should be noted that management increased their dividend payout, from $.37 per share, per year following their most recent earnings report. Their dividend payout ratio is also conservative, at less than 25% of their earnings over the last year.
Price/Book Ratio: there are a lot of ways to measure how much a stock should be worth; but I like to work with a combination of Price/Book and Price/Cash Flow analysis. Together, these measurements provide a long-term, fair value target around $33.70 per share. That means the stock is somewhat overvalued at its current price, with -2% downside from its current price, and with a useful bargain price at around $27.
Technical Profile
Here’s a look at the stock’s latest technical chart.
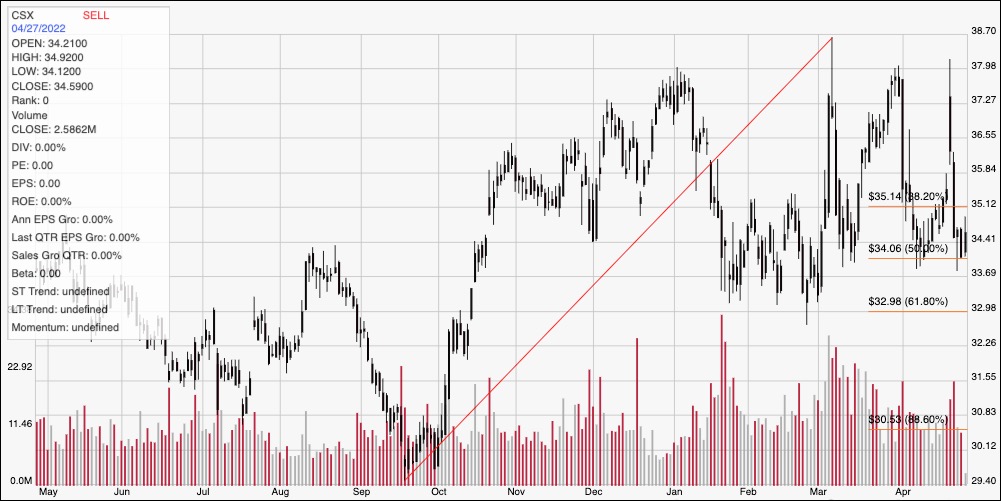
Current Price Action/Trends and Pivots: The chart above displays the past year of price activity for CSX. The red diagonal line traces the stock’s upward trend from its September 2021 low at around $29.40 to its March peak at around $39. It also provides the baseline for the Fibonacci retracement levels outlined on the right side of the chart. From that peak, the stock has settled into a somewhat volatile trading range, with $38 providing top-end (not immediate) resistance and $34 acting as current support around the 50% retracement line. The stock is currently sitting very near that support level, with immediate resistance at around $35 past on pivot highs seen in February. A push above $35 should have room to see the stock test next resistance at around $36.50, with additional upside to about $38 if buying activity accelerates. A drop below $34 appears to have limited downside to about $33 where the 38.2% retracement line rests, but an acceleration of selling pressure could increase downside risk at about $30.50 if $33 is broken.
Near-term Keys: From a long-term perspective, it’s hard to see a lot of long-term upside in CSX, despite its strong fundamental profile. While Free Cash Flow is increasing, I also consider the company’s decline in earnings and Net Income as a red flag that bears watching. Based on the fair value analysis I described earlier, the stock wouldn’t offer a compelling value-based price unless it drops to around $27 per share – which is about -22% below the stock’s current price. That means the best opportunities to work with the stock are with short-term, momentum-oriented trades. A push above $35 could offer a signal to consider buying the stock or working with call options, with a useful target price at around $36.50. Even with the stock’s current bearish momentum, there appears to be very limited foreseeable downside below current support, which also means that looking for a bearish trade right now is a very low-probability prospect. A drop below $33, however could be a useful signal to consider shorting the stock or buying put options, with a practical exit target at around $30.50 per share on a bearish trade.