Over the last two years, a lot of interesting storylines about the market, the economy, and consumer habits and trends have given investors useful ways to find practical investing opportunities. While the pandemic shuttered all kinds of business and economic activity in early 2020, for example, one area of the marketplace that saw big surges in demand was streaming media. That’s not surprising, of course, since stay-at-home and shelter-in-place orders meant that for a lot of people, there wasn’t much else to do than sit down and find a familiar, favorite movie or TV show to binge for hours on end.
During 2020, companies focused on streaming services like Netflix (NFLX), Disney (DIS), Amazon (AMZN), and so on saw big increases in their stock prices, as subscriber growth rates surged. 2021 saw some of that price activity normalize, but remain very high.
This year has painted a bit of a different story, with each of the three stocks I just mentioned coming off of their 2021 highs by about -50% in most cases. Plateauing subscriber levels – or, even worse in a couple of cases, reports of declining new subscribers – have left analysts asking questions about the sustainability of the massive borrow and spending habits these companies have employed to populate their services with content to keep consumers engaged.
One of the companies that I’ve been following for quite a while, and been using in my value-focused system is Paramount Global (PARA). This is a company formed from a merger between Viacom and CBS Corporation, creating a combined television and film studio designed to stand on its own in the Media industry of the Communication Services sector. This is an industry that has become dominated by streaming services, with major TV and film studios like Disney, Warner Bros., and ViacomCBS all looking for a foothold to compete with Netflix and Amazon, to name just a couple of industry disruptors. Two quarters ago, the company renamed itself from ViacomCBS to Paramount Global and adopted its current stock symbol. While Paramount has name-brand recognition, and carries weight in the TV and film industry, the name change was intended to reflect the company’s focus on shifting its business model to leverage its massive library of movies and shows, its production capabilities and strengths in those legacy businesses in improving its own stake in the streaming media space.
One of the big number analysts in this space pay a lot of attention to is new subscriber rates. PARA owns Paramount+, its paid streaming service with access to movies, new and legacy TV titles, and live news and sports content, as well as Pluto TV, one of the world’s biggest free, ad-supported streaming platforms. Combined, these services give PARA an interesting foothold in the streaming media segment, with more than 130 million subscribers, and the company planning to expand their availability into the UK and much of Western Europe through the rest of this year. They’ve prepared for that launch in part by forging agreements for live sports broadcasts of European sporting events such as Euroleague soccer (nee´ football). In the area of traditional media, the company has benefitted from early success as consumers return to theaters in the early part of this year and more expected with summer blockbusters like Top Gun: Maverick coming on deck. Where its competitors rely on studio licensing agreements for legacy content, or to spend massive amounts of borrowed money to fund new projects, PARA’s massive, existing libraries give it the ability to generate low-cost, incremental consumption that makes its multiplatform offerings even more interesting.
The real question, of course is what all of that means for the stock. The stock diverged from most of its brethren in early 2021, plunging from a peak at around $100 to about $40 in a matter of just a few Reddit-fueled trading days. In late 2021, the stock dropped down to new lows at around $29 but appeared to be establishing a new consolidation base until late April of this year. Bearish momentum in the market, along with broad momentum against companies in the streaming media space have pushed the stock to a new, 52-week low as of this writing at around $26. Is the fundamental story for PARA really that bad, or is this just broader, industry-specific momentum having its way with a stock that should be worth more? Let’s try to find out.
Fundamental and Value Profile
Paramount Global, formerly ViacomCBS Inc., is a global media and entertainment company that creates content for audiences worldwide. The Company’s business segments include TV Entertainment, Cable Networks, and Filmed Entertainment. The TV Entertainment segment operates the CBS Television Network, its domestic broadcast network; CBS Studios and CBS Media Ventures, its television production and syndication operations; CBS branded streaming services, including CBS All Access/Paramount+; CBS Sports Network, and its cable network focused on college athletics and other sports. The Cable Networks segment operates a portfolio of streaming services, including Pluto TV, a free advertising-supported streaming television (FAST) service and Showtime Networks’ subscription streaming service (SHOWTIME OTT). The Filmed Entertainment segment operates Paramount Pictures, Paramount Players, Paramount Animation and Paramount Television Studios, and also includes Miramax, a consolidated joint venture. PARA has a current market cap of about $17.3 billion.
Earnings and Sales Growth: Over the last twelve months, earnings declined by about -60.5%, while revenue slid back by -1.13%. In the last quarter, earnings were almost 130% higher, while revenues declined by -8.4%. Over the last twelve months, Net Income was 14.26% of Revenues, and declined significantly, to 5.91% in the last quarter. The decline is attributable, at least in part, to the company’s aggressive investments in expanding its digital footprint; it entered the streaming media space well behind its larger competitors and is still playing catch-up.
Free Cash Flow: PARA’s free cash flow has been declining for most of the past year as the company invests heavily in expanding its streaming presence. In the last quarter, Free Cash Flow was -$717 million, versus $2.6 billion a year ago. This sounds alarming, but considered in a longer-term view this looks like a major build-up of its streaming platform to enable it to compete more effectively against its competition. I think it is worth noting that management is forecasting those efforts to begin paying dividends in 2023, while skeptical analysts are pointing to 2024. I’ll split the difference and say that if you like this company, you may need to think about the possibility of playing a long-term waiting game until late 2023.
Dividend: VIAC’s annual divided is $.96 per share, which translates to a yield of 3.6% at the stock’s current price.
Debt/Equity: PARA carries a Debt/Equity ratio of .73, which is a significant drop from 1.23 at the beginning of 2021, .84 two quarters ago and .77 in the quarter prior. Their balance sheet shows about $5.3 billion in cash and liquid assets versus about $16.7 billion in long-term debt. Their operating profile suggests that, while Net Income is narrowing, debt service isn’t a problem. An extension of the current Free Cash Flow and Net Income, pattern could further erode liquidity (PARA reported close to $6.3 billion in cash two quarters ago), which means the quarters ahead certainly bear watching. Management has also indicated their intention to use their cash position to further reduce debt and increase shareholder returns (presumably in the form of stock buybacks and/or dividend increases).
Price/Book Ratio: there are a lot of ways to measure how much a stock should be worth; but I like to work with a combination of Price/Book and Price/Cash Flow analysis. For additional context, I’ve also incorporated estimated growth rates into my analysis. All together, these measurements provide a long-term, fair value target a little above $66 per share. That suggests that the stock remains massively undervalued, with about 148% upside (not a typo) from its current price.
Technical Profile
Here’s a look at the stock’s latest technical chart.
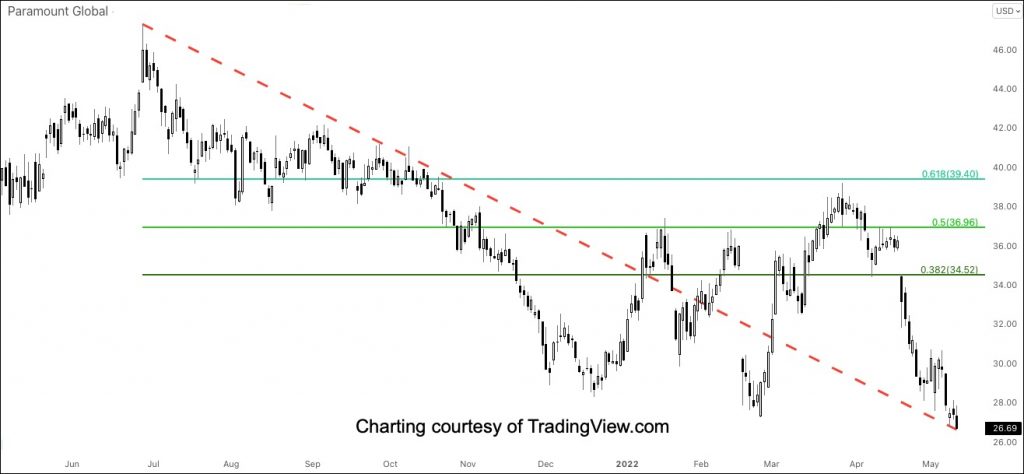
Current Price Action/Trends and Pivots: This chart looks at the last year of price activity for PARA. The red diagonal line measures the length of the stock’s downward trend from its July 2021 high at around $47 to its most recent low, reached this week a little below $27. It also informs the Fibonacci trend retracement lines shown on the chart. The stock held a strong consolidation between $42 and $38 until mid-October 2021, before larger economic questions finally pushed the stock out of that range late that month. The stock stabilized beginning in December and began setting a new, broader consolidation range between $28 and $36 through the early part of February, when the downward trend picked up momentum again, pushing the stock back down to a new, lower low. After another temporary rally to a little below $40, the stock followed industry momentum to push back to the bottom of its current consolidation range, and has broken below the support expected at around $28. New, current support could sit at around $26, with $28 expected to act as new, immediate resistance. A push above resistance appears to have limited upside, to about $30 based on pivot activity in that range in January of this year. A drop below $26 should find next support around $24.
Near-term Keys: The deterioration of PARA’s core fundamental metrics – especially Free Cash Flow and Net Income – are a big concern, but as with everything, context is everything when you are working with a long-term investing strategy. I do think that the stock’s current momentum, along with the weakening fundamental profile mean that thinking about a new, value-oriented investment is risky; I would wait to see if Net Income and Free Cash Flow stabilize or even reverse before taking a new opportunity seriously. If you prefer to work with short-term trading strategies, you can also take a break above $28 as a signal to think about buying the stock or working with all options, with $32 offering an aggressive, quick-hit bullish profit target. A drop below $26 could be an interesting signal to consider shorting the stock or buying put options – but be quick to take profits at around $24 on a bearish trade.