One of the sectors that I have learned to pay attention to as a barometer for the underlying relative health of the economy is the Materials sector, because the companies that comprise it produce or mine many of the raw materials that make up the building blocks for most of the finished goods we use every day. The sector includes industries that cover chemicals and plastics, construction materials, paper, forest, and packaging products, as well as metals and minerals – which means that in some form, this sector touches practically every other segment of the economy in one more or another.
Since 2022 started, the market’s volatility has increased amid inflation and interest rate fears, and have been compounded by Russia’s invasion of Ukraine. During that time, stocks in the Materials sector have certainly not been immune to the broad market’s momentum.
With energy prices holding at levels not seen in nearly a decade, the challenges that have driven the market’s momentum so far this year seem likely to remain in place. That means they could continue to act as a headwind to blunt the pace of economic growth that has prompted the Fed to predict more aggressive, incremental interest rate increases throughout the year. Whether these varying elements will be a positive, or a negative for the Materials sector depends, I think on the specific niche a company operates in.
Huntsman Corp (HUN) is a company that has benefitted from a homebuilding industry that has been surprisingly robust since late 2020 and all of last year, as residential construction saw big increases in numerous parts of the country. From its bear market low in March at around $12, the stock more than doubled in price by the end of 2020, and peaked in late February of this year at almost $42. From that point, however, the stock followed broad market momentum downward, picking up bearish momentum that saw the stock finally find a bottom a little above $33 in the early part of this month. Since then, the stock has begun to build bullish momentum, sitting a little above $36 as of this writing. That move seems to dovetail nicely with a fundamental profile that includes increasing cash flow, a strengthening balance sheet and measurable improvement in its operating profile. Against that fundamental backdrop, the stock’s latest price activity begs the question of whether the stock might offer a useful value proposition, along with a nice technical bullish signal to think about. Let’s find out!
Fundamental and Value Profile
Huntsman Corporation is a manufacturer of differentiated organic chemical products and of inorganic chemical products. The Company operates all of its businesses through its subsidiary, Huntsman International LLC (Huntsman International). The Company operates through five segments: Polyurethanes, Performance Products, Advanced Materials, Textile Effects, and Pigments and Additives. Its Polyurethanes, Performance Products, Advanced Materials and Textile Effects segments produce differentiated organic chemical products and its Pigments and Additives segment produces inorganic chemical products. The Company’s products are used in a range of applications, including those in the adhesives, aerospace, automotive, construction products, personal care and hygiene, durable and non-durable consumer products, digital inks, electronics, medical, packaging, paints and coatings, power generation, refining, synthetic fiber, textile chemicals and dye industries. HUN’s current market cap is $7.6 billion.
Earnings and Sales Growth: Over the last twelve months, earnings increased 80.3%, while revenues grew a little over 30%. In the last quarter, earnings were 25.26% higher while revenues were 3.5% higher. HUN’s operating profile declined in the first couple of quarters of 2021, but has shown remarkable improvement since then. In the last year, Net Income was 13.16% of Revenues, but did weaken to 9.33% in the last quarter.
Free Cash Flow: HUN’s free cash flow is $741 million. This marks an improvement over the last year, when Free Cash Flow was -$8 million, and $610 million in the last quarter. The current number translates to a useful Free Cash Flow Yield of 9.66%. It is also noteworthy that HUN’s Free Cash Flow saw a peak at $1.2 billion in June 2018, and has declined from that point, but the turn over the last three quarters, along with improving liquidity (see next) to me signal that the company has successfully navigated that storm.
Debt to Equity: HUN has a debt/equity ratio of .34. This is a conservative number that has also decreased since the beginning of 2020 from .77. HUN’s balance sheet has also seen significant improvement in the last quarter, as total cash in the last quarter was about $807 million (up from $505 million six months ago), while long-term debt is $1.53 billion.
Dividend: HUN pays an annual dividend of $.85 per share, which translates to an annual yield of about 2.32% at the stock’s current price. It is also worth noting that management increased the dividend two quarters ago, from $.75 per share, and from $.65 per share earlier in 2021.
Price/Book Ratio: there are a lot of ways to measure how much a stock should be worth; but I like to work with a combination of Price/Book and Price/Cash Flow analysis. Together, these measurements provide a long-term, fair value target at around $45 per share. That suggests that at its current price, the stock is undervalued by about 23%. It should also be noted that the improvements I’ve already described have increased this metric from the $42.50 level that my last analysis prior to the latest earnings report yielded.
Technical Profile
Here’s a look at the stock’s latest technical chart.
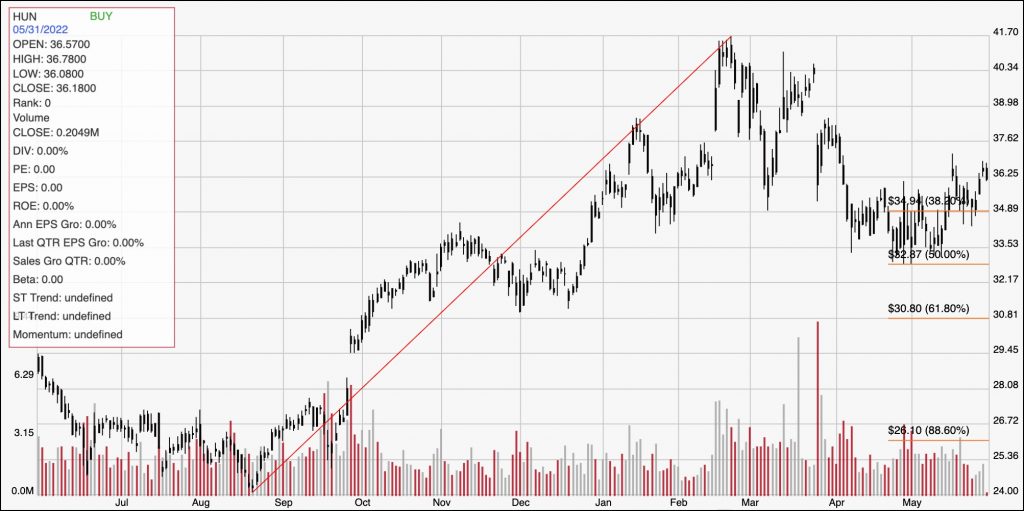
Current Price Action/Trends and Pivots: The diagonal red line on the chart above traces the stock’s upward trend from a low at around $24 in August 2021 to its high point around $42 in February. It also provides the baseline for the Fibonacci retracement lines shown on the right side of the chart. The stock found a bottom for its intermediate downward trend in the early part of May at around $33 and has been picking up bullish momentum, pushing above the 38.2% retracement line at around $35 to mark current support at that point. I see immediate resistance at around $38 based on pivot activity in late March and mid-January. A drop below $35 should find next support at around $33 where the 50% retracement sits and where significant pivot low activity occurred at the end of April and beginning of this month.
Near-term Keys: HUN’s current momentum is turning bullish, which means that if you prefer to focus on short-term trading strategies, a bullish trade right now could offer short-term upside for either buying the stock or working with call options to about $38. A drop below $35 could act as an interesting signal to think about shorting the stock or buying put options, with an eye on next support around $33 as a practical profit target on a bearish trade. The company’s fundamentals support HUN as an interesting value at its current price. If you’re willing to accept the potential for continued, high volatility in the market right now, this could be an interesting long-term opportunity.