There is a pretty significant difference in the way different investors perceive a stock in a long-term upward trend. For growth oriented-investors, the longer the upward trend, the more attractive the stock is, simply because the expectation is that the longer, bullish trend will outlast any near-term, bearish sentiment or momentum the stock may see. On the other hand, a stock in an upward trend – especially a long-term one – is something that typically leads value-oriented investors to shun it. That is especially true if, like me, they also tend to operate with a bit of a contrarian view of the world.
The challenge for value investors is that sometimes, a stock in a long downward trend has a very good reason for being where it is – sometimes, a cheap stock is just a cheap stock.
Efficient market theory holds that in the broadest sense, the market is very good at pricing a company’s underlying fundamental weakness or strength into a stock’s price. That is often very much the case, which is why it is important to always be careful about considering a stock in a long-term downward trend for any kind of bullish position. It’s why I concentrate not only on a stock’s value proposition, but also make sure to run through a detailed view of the company’s business.
For stocks in long-term upward trends, efficient market theory holds that the most likely reason for the increase is the fundamental strength of the underlying business, which naturally attracts more investors to it. The problem with that notion for value investors is that, more often than not, a stock’s increase in price during a long-term upward trend tends to significantly outpace any increase or growth in the company’s actual business or improvement in the bottom line. If sales and earnings increase 10%, for example, a stock’s comparative increase in price will often be 2.5 to 3 times higher. At some point, the stock is simply too expensive to justify an investment.
The idea that trends tend to follow the direction of their longer trend is a technical idiom that tends to contribute to the “buy the dip” mentality that often comes to play when a stock starts to drop off of a recent high point. The dip comes when growth investors start taking profits; the increase in selling activity puts downward pressure on the price until investors decide the stock is at a good price again, and then start buying the stock again. For a value investor, those dips become more interesting the further away from the last high the stock falls, because it increases the chances the stock’s useful value price will fall into line with its current price.
The Mosaic Company (MOS) is a company in the Materials sector I’ve followed for some time that followed the broad market over the past year, with an upward trend that from July of last year to a peak in mid-April that saw the stock more than double in value. From that peak at around $79, however, the stock has since dropped more than -20%, running right around $60 as of this writing. That kind of drop can signal potential problems, but can also often simply reflect the same investor tendency to overreact to news and events – which is why drops like this also tend to pique the interest of bargain hunters like myself. What do the company’s fundamentals say about how much the stock should be worth? Let’s find out.
Fundamental and Value Profile
The Mosaic Company is a producer and marketer of concentrated phosphate and potash crop nutrients. The Company operates through three segments: Phosphates, Potash and International Distribution. The Company is a supplier of phosphate- and potash-based crop nutrients and animal feed ingredients. The Phosphates segment owns and operates mines and production facilities in Florida, which produce concentrated phosphate crop nutrients and phosphate-based animal feed ingredients, and processing plants in Louisiana, which produce concentrated phosphate crop nutrients. The Potash segment mines and processes potash in Canada and the United States, and sells potash in North America and internationally. The International Distribution segment markets phosphate-, potash- and nitrogen-based crop nutrients and animal feed ingredients, and provides other ancillary services to wholesalers, cooperatives, independent retailers and farmers in South America and the Asia-Pacific regions. MOS has a current market cap of about $21.5 billion.
Earnings and Sales Growth: Over the last twelve months, earnings increased almost 323% (not a typo), while revenues improved by 70.75%. In the last quarter, grew by about 23.6%, while increased by 2.12%. The company’s margin profile has been healthy over the past year, with a big jump in the last quarter; over the last twelve months, Net Income was almost 19% of Revenues, and increased to 30.14% in the last quarter.
Free Cash Flow: MOS’s free cash flow over the last twelve months is $1.1 billion. That’s a significant improvement over the last two quarters; this number was $684 million six months ago. The current number also translates to a Free Cash Flow Yield of 4.9%.
Debt to Equity: MOS has a debt/equity ratio of .29. This is a conservative number. MOS currently has $926.5 million in cash and liquid assets against about $3.3 billion in long-term debt. The company’s balance sheet, along with their improving operating profits indicate that the company has no problem servicing the debt they have.
Dividend: MOS’s annual divided is minimal, at only $.60 per share; that translates to a yield of just 0.96% at the stock’s current price. It is worth noting that the dividend increased from $.30 per share, per annum at the end of 2021 to $.44 per share, and then to its current level after the latest earnings report.
Price/Book Ratio: there are a lot of ways to measure how much a stock should be worth; but I like to work with a combination of Price/Book and Price/Cash Flow analysis. Together, these measurements provide a long-term, fair value target around $47 per share. That means that even with the stock’s drop so far, MOS remains overvalued, with about -25% downside from its current price, and a useful bargain price sitting at around $37.50.
Technical Profile
Here’s a look at the stock’s latest technical chart.
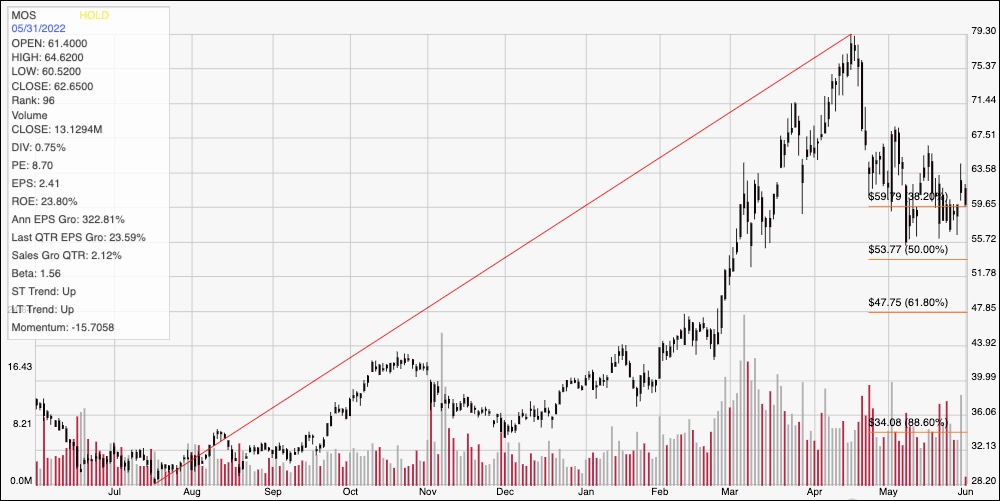
Current Price Action/Trends and Pivots: The red line on the chart above outlines the stock’s upward trend from July of last year to its peak in mid-April at around $79; it also informs the Fibonacci retracement levels on the right side of the chart. The stock has dropped a little over -24% from that high, and putting the stock right around the 38.2% retracement line, where it has marked current support at around $59 per share. Immediate resistance is at around $64, based on pivot high activity in May. A push above $64 should find next resistance at around $67.50, while a drop below $59 should find next support somewhere between $56 and $53, where the 50% retracement line sits.
Near-term Keys: MOS’ current momentum is clearly bearish which makes a bullish near-term trade aggressive and somewhat speculative; however a bounce off of current support could offer near-term upside for buying the stock or working with call options to about 64 per share. A drop below $59 to consider shorting the stock or buying put options, using $56 as a quick-hit profit target and $53 if bearish momentum accelerates. While MOS does have some very interesting elements of fundamental strength the fact is that MOS remains overvalued right now. Long-term investors should tuck this stock away for now and come back to take another look in a quarter or two.