Every sector of the economy has elements that make it interesting, both by itself and in how it may relate to other sectors and industries. One of the sectors that I like to pay attention to as a barometer for broad economic health is the Materials sector.
The industries that make up the Materials sector – Chemicals, Paper and Forest Products, Steel, Building Materials, and more – make up a portion of the finished goods that are produced by so many industries in other sectors. Another industry that is industry, if a bit unpredictable is the Mining industry. I say unpredictable because this is the industry that produces precious metals and other minerals, where prices can be volatile depending not only on economic conditions but, perhaps even more significantly to market whim.
When economic uncertainty increases because of rising inflation and the interest rate increases that inevitably accompany it, precious metals and minerals are often seen as a good, defensive hedge against inflation risk. The last month has seen market uncertainty increase, and to be reflected by a certain degree of irrationality that has pushed stocks in these defensive sectors down with the rest of the market. In many cases, these declines in stock prices fly directly in the face of company fundamentals that demonstrate materials gains in fundamental metrics. In my mind, that actually makes the sector more interesting – because the implication is that the decline in stock price, while fundamentals remains solid, should increase the stock’s value proposition.
Teck Resources Ltd. (TECK) is an interesting company in the Mining industry of the Materials sector that I think is a good illustration of what I mean. The company recovered from a challenging 2020 and is showing healthy profitability along with improving free cash flow and a strengthening balance sheet. Those fundamental strengths helped push the stock to a 52-week high at the beginning of June at around $46 per share, after which the broad market has pulled it down by a little over -30% as of this writing. Has the stock dropped far enough to present a useful value opportunity for bargain hunters with a contrarian mindset, or is there more downside ahead? Let’s find out.
Fundamental and Value Profile
Teck Resources Limited is a Canada-based mining company. The Company’s segments include steelmaking coal, copper, zinc and energy. The Company owns or has interests in approximately 10 operating mines, a metallurgical complex, and several major development projects in the Americas. Its projects include Fording River Extension Project, HVC 2040 Project, Galore Creek Project, Quintette Project, Quebrada Blanca Phase 2 Project, Relincho and El Morro Projects and others. Its Fording River Extension Project is a proposed extension of its existing Fording River steelmaking coal mine located in the East Kootenay region in southeastern British Columbia. Its Galore Creek Project is located within the territory of the Tahltan Nation in northwestern British Columbia, approximately 150 kilometers northwest of Stewart. Its Quintette Project is located in northeast British Columbia, approximately 20 kilometers south of the town of Tumbler Ridge. TECK’s market cap is about $17.1 billion.
Earnings and Sales Growth: Over the last twelve months, earnings increased 387.5%, while sales increased by 97.5%. In the last quarter, earnings grew by 15.85%, while sales were 13.65% higher. The company’s margin profile is very healthy, but showing some signs of deterioration; over the last twelve months, Net Income was 31.22%, and declined to 25.88% in the most recent quarter. The decline could be a cyclical element, and the fact is that even with the lower quarter number, Net Income remains very healthy, so this is a minor warning sign at best.
Free Cash Flow: TECK’s free cash flow was about $1.9 billion over the past twelve months and translates to a Free Cash Flow Yield of 11.43%. It should be noted that Free Cash Flow has increased significantly over the past year from -$1.04 billion a year ago, and about $552 million in the last quarter.
Dividend Yield: TECK’s dividend is $0.385 per share, and translates to a yield of 1.22% at its current price.
Debt to Equity: TECK has a debt/equity ratio of 0.29. This is a very conservative number that implies conservative approach to the use of leverage by management. TECK’s balance sheet also shows about $1.95 million in cash (compared to about $310 million six months ago) and liquid assets against $5.7 billion in long-term debt.
Price/Book Ratio: there are a lot of ways to measure how much a stock should be worth; but I like to work with a combination of Price/Book and Price/Cash Flow analysis. Together, these measurements provide a long-term, fair value target around $29 per share. That suggests that the stock is overvalued right now, with -11% downside from its current price, and with a useful discount price at around $23.50.
Technical Profile
Here’s a look at the stock’s latest technical chart.
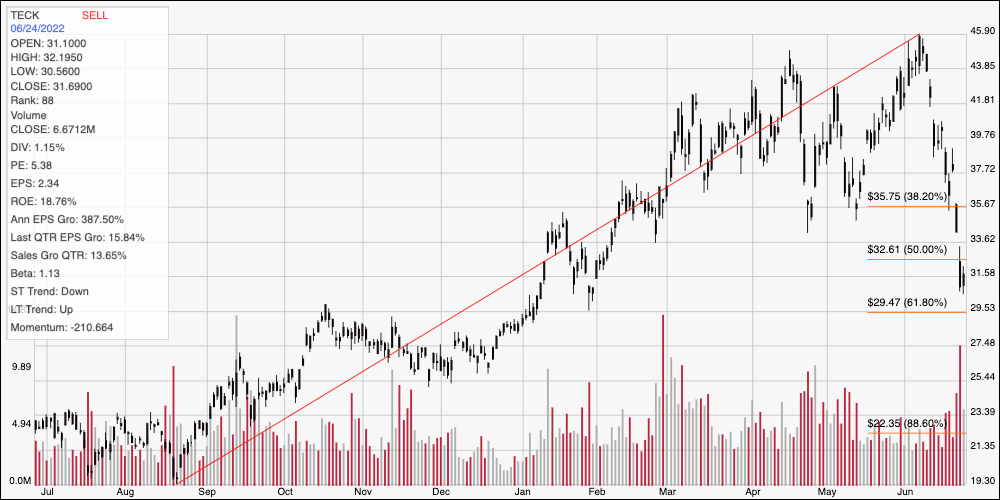
Current Price Action/Trends and Pivots: This chart traces the stock’s movement over the last year. The diagonal red line traces the stock’s upward trend from from its low point in August of last year at around $19 to its high this month at around $46. It also acts as the baseline for the Fibonacci retracement lines shown on the right side of the chart. The stock has dropped back sharply in the last couple of weeks, falling from that 52-week high and through the 38.2% and 50% retracement line to its current level at around $32. Expected, current support should be at around $29.50 based on the placement of the 61.8% retracement line along with pivot activity at the end of last year and in January of this year at around that level. Immediate resistance is around $33.50. A drop below $29.50 could see about $4 of downside to next support at around $25.50, while a push above $33.50 should find next resistance at the 38.2% retracement line, which sits at around $36 per share.
Near-term Keys: With the exception of Net Income, TECK’s fundamentals have been improving in spite of the stock’s strongly bearish momentum this month. Even with the recent drop, however, the stock remains overvalued, which means that the best probabilities lie in short-term, momentum-based trading strategies, You could use a bounce off current support at around $29.50 as a signal to think about buying the stock or working with call options, using immediate resistance at around $33.50 as a near-term exit target for a short-term bullish trade. A drop below $29.50 could act as a signal to consider shorting the stock or buying put options, using $25.50 a practical, quick-hit profit target on a bearish trade.