Any experienced investor, no matter what their investment philosophy is, will undoubtedly tell you that one of the most useful ways they keep track of new opportunities as they come up is by maintaining a watchlist of stocks that they can check on a regular basis. A good, diversified list of stocks in a variety of different industries can be an effective way to keep your investing functional, no matter what the ebb and flow of market sentiment is doing at any given time, since as one industry may be moving out of favor with investors, another will undoubtedly be moving into favor.
2022 has kept a lot of people on edge as the health of the global economy has come into question. Inflationary indicators have led to rising interest rates, which have also been compounded by the effect of coordinated economic sanctions by the Western world against Russia from its war against Ukraine. That conflict continues to feed uncertainty, since there remain unanswered questions of how long it will extend and what the final outcome will be. Add to that questions about whether the Fed will manage to raise rates enough to slow the pace of inflation, but not push the economy into actual recession, and it really isn’t surprising that the market’s natural tendency to forecast its fears has kept all of the major market indices in bear market territory for most of the past three months.
The market’s drop has been broad enough to pull most of the sectors and their respective industries of the economy into their own respective bear market levels. That includes stocks like Eastman Chemical Co. (EMN), one of the biggest companies in the Chemicals industry. The stock hit a high point in January at around $129.50 before following the market into its own bear market, hitting its most recent low about a week ago around $85. That’s a -34% drop that has the stock visiting price level it hasn’t seen since 2020.
While most companies is just about every sector have seen a COVID-driven, material impact, as a company, EMN has actually shown strength throughout the the last two and a half years, which is a big reason the stock more than quadrupled in value from its March 2020 low a little above $30 per share to its peak to start this year. The real question now, of course is whether the company’s big drop in price just makes the stock a great value, or whether there could be more downside to watch for? Let’s find out.
Fundamental and Value Profile
Eastman Chemical Company (Eastman) is an advanced materials and specialty additives company. The Company’s segments include Additives & Functional Products (AFP), Advanced Materials (AM), Chemical Intermediates (CI), and Fibers. In the AFP segment, it manufactures chemicals for products in the coatings, tires, consumables, building and construction, industrial applications, including solar energy markets, animal nutrition, care chemicals, crop protection, and energy markets. In the AM segment, it produces and markets its polymers, films, and plastics with differentiated performance properties for end uses in transportation, consumables, building and construction, durable goods, and health and wellness products. The CI segment leverages large scale and vertical integration from the cellulose and acetyl, olefins, and alkylamines streams to support its specialty operating segments. Its product lines in Fibers segment include Acetate Tow, Acetate Yarn and Acetyl Chemical Products. EMN’s current market cap is $11.4 billion.
Earnings and Sales Growth: Over the last twelve months, earnings declined by about-3.3% while revenues were 12.66% higher. In the last quarter, earnings improved by nearly 14% while sales were flat, but 0.74% higher. The company’s margin profile is showing signs of improvement that I think reflect the company’s intentional positioning in defensive-oriented sectors like Consumer Staples. Net Income for the last twelve months was 7.59% of Revenues, and increased to 8.66% in the most recent quarter.
Free Cash Flow: EMN’s free cash flow is healthy, at $824 million. This is a number that increased significantly since 2017, from about $650 million, but has declined from about $1.1 billion a year ago. It also translates to a Free Cash Flow yield of about 7.05%.
Debt to Equity: EMN has a debt/equity ratio of .73, implying a generally conservative approach to debt management. The company’s balance sheet indicates their operating profits are more than adequate to service their debt for the time being, with increasing Net Income a good reflection of their improving financial flexibility. Their balance sheet shows $487 million in cash and liquid assets (a decline from $717 million six months ago) versus about $4.4 billion in long-term debt. I think it also noteworthy that EMN has decreased their debt from $5.4 billion in 2020 at the height of the pandemic.
Dividend: EMN pays an annual dividend of $3.04 per share, which translates to a yield of about 3.35% at the stock’s current price. It should also be noted that management increased their dividend payout from $2.64 per share at the end of 2021 to its current level, which is an additional sign of confidence in their business model moving forward.
Price/Book Ratio: there are a lot of ways to measure how much a stock should be worth; but I like to work with a combination of Price/Book and Price/Cash Flow analysis. Together, these measurements provide a long-term, fair value target at around $77 per share. That means that, even with the stock’s current drop, it remains overvalued, with -13% downside from the stock’s current price, and with a practical discount price at around $62 per share.
Technical Profile
Here’s a look at the stock’s latest technical chart.
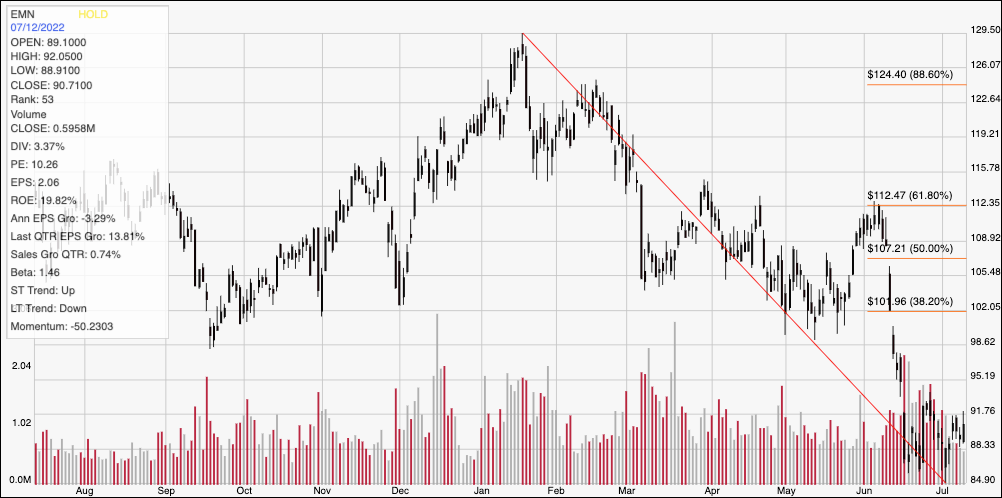
Current Price Action/Trends and Pivots: The diagonal red line traces the stock’s downward trend from $129.50 in January of this year to its low point, reached this month at around $85; it also provides the reference for calculating the Fibonacci retracement levels indicated by the horizontal red lines on the right side of the chart. The stock has been hovering in a range for the last month between current support at $85 and immediate resistance at about $91. A push above $91 should have short-term upside to about $98, while a drop below $85 could see the stock drop to about $79 before finding next support.
Near-term Keys: There really is no way right now, despite EMN’s current bear market drop, fundamental strengths and attractive dividend, to also call the stock a useful value; the stock would need to fall to about $62 before a practical, useful discount would really be available. If you prefer to work with short-term strategies, I would pay close attention to the stock’s current support and resistance levels. A push above $92 could offer a decent signal to consider buying the stock or working with call options, with $98 acting as a practical profit target on a bullish trade. A drop below $85 would be a good signal to this about shorting the stock or buying put options, with $79 acting as a good profit target on a bearish trade.