Contrarian investors and bargain hunters tend to think quite a bit differently about stock price movements and trends than growth-focused investors. When everybody is buying, we tend to get more cautious, and when everybody is running for the exits, we start finding more and more attractive opportunities at great prices.
2022 has been a rough year for just about every investing strategy, no matter whether you focus on growth or value. The fact is that the mere fact a stock may have already dropped really says nothing about whether it will continue to fall or when it will reverse. That’s also one of the reasons that contrarians and value investors like myself spend a lot of time thinking about how much a stock should be worth. We also have to measure whether the long-term opportunity is great enough to justify the real possibility of buying and holding a stock through a continued, potentially long-term downward trend.
One area that has remained resilient, but certainly not immune to broader pressures throughout the past two years is the Food Products industry. For most of 2021, stocks in this industry not only kept pace with the market, but in many cases outperformed the sexier, growth-driven industries and names. Diving into the fundamentals of many of these companies have shown balance sheets that continue to weather the storm, first from the pandemic and now from increasing inflationary indicators better than most other industries. That increasing fundamental strength was a big driver in stock price performance in 2020 and 2021, but some of the luster has come off of those stocks this year.
In the Food Products industry, those inflationary indicatorsI have begun rippling into consumer price levels. With interest rates expected to continue to rising in 2022 and possibly into 2023 to attempt to curb inflation, this looks like a headwind that is unlikely to be resolved any time soon. These are pronounced in many cases by persistent labor shortages that continue to limit capacity and productivity in ways that have begun to limit product availability for consumers. That means that while the Food Products industry is likely to continue to see healthy demand, how much it is able to rise to meet demand remains an open question.
Tyson Foods Inc. (TSN), is a stock I’ve followed for some time. 2020 wasn’t good for the stock; from a January peak at around $94, the stock began a downward slide that only accelerated in March as the entire stock market moved into bear market territory. TSN did find a bottom at around $44 with the rest of the market, and by the end of 2020, the stock was sitting at around $62.50. 2021 saw the stock extend its long-term upward trend even more, hitting a 52-week high in February of this year at around $100. From that point, the stock has followed the rest of the market lower and into its bear market territory, and is now sitting at around $83 per share.
The company has invested heavily since early 2020 to address safety concerns, and that is something that in the early stage of the health crisis acted as a drag on the bottom line; but the company’s most recent earnings reports suggest not only that it continues to navigate those coronavirus-driven headwinds, but that it has benefited from increases in protein demand in the U.S. and overseas. An epidemic of African Swine Flu in 2018 ravaged the domestic hog population in China, the world’s largest pork producer and exporter, leaving a long-term protein shortage in that part of the world that is expected to continue for years to come, and puts U.S. protein producers like TSN in a position of strength. Compared against the stock’s current trend, does that mean the stock’s latest decline now offers a good value-based opportunity?
Fundamental and Value Profile
Tyson Foods, Inc. is a food company, which is engaged in offering chicken, beef and pork, as well as prepared foods. The Company offers food products under Tyson, Jimmy Dean, Hillshire Farm, Sara Lee, Ball Park, Wright, Aidells and State Fair brands. The Company operates through four segments: Chicken, Beef, Pork and Prepared Foods. It operates a vertically integrated chicken production process, which consists of breeding stock, contract growers, feed production, processing, further-processing, marketing and transportation of chicken and related allied products, including animal and pet food ingredients. Through its subsidiary, Cobb-Vantress, Inc. (Cobb), the Company is engaged in supplying poultry breeding stock across the world. It produces a range of fresh, frozen and refrigerated food products. Its products are marketed and sold by its sales staff to grocery retailers, grocery wholesalers, meat distributors, warehouse club stores and military commissaries, among others. TSN has a current market cap of $30.1 billion.
Earnings and Sales Growth: Over the last twelve months, earnings increased almost 71%, while sales increased more than 16%. In the last quarter, earnings were a little more than -20% lower while sales rose by 1.42%. TSN traditionally operates with a modest margin profile; in the last twelve months, Net Income was 7.9% of Revenues, but decreased to 6.32% in the last quarter.
Free Cash Flow: TSN’s Free Cash Flow is healthy, at a little more than $2.2 billion. That number has increased from about $1.6 billion at the beginning of 2020, but dipped from about $2.6 billion a year ago, and $2.55 billion in the quarter prior. Its current level translates to a Free Cash Flow yield of 7.31%.
Debt to Equity: TSN has a debt/equity ratio of .43, which is conservative. Cash and liquid assets were about $437 million at the end of 2019, increased to $2.4 billion at the end of 2020, and were just a little under $2.2 billion in the last quarter. TSN carries about $8.3 billion in long-term debt. The company’s operating profile indicates there should be no problem servicing debt, with the company demonstrating the ability to navigate cyclical and economic challenges successfully from quarter to quarter as they come.
Dividend: TSN increased its annual dividend from $1.68 per share to $1.78 per share in 2020, and again to $1.84 per share late last year. That new number translates to a dividend yield of 2.2% at the stock’s current price. TSN’s dividend has also increased from $1.20 per share in late 2018, and $1.52 at the end of 2019. The fact that management not only maintained the higher dividend, but increased it during the pandemic despite the early challenges it had to deal with in adjusting to broad operating conditions is noteworthy since so many other companies were forced to reduce or suspend their dividends during the same period.
Price/Book Ratio: there are a lot of ways to measure how much a stock should be worth; but I like to work with a combination of Price/Book and Price/Cash Flow analysis. Together, these measurements provide a long-term, fair value target around $89 per share. That means that despite the stock’s decline, it still has room to go before offering a useful bargain proposition, with just 6% upside from its current price, and a compelling discount price at around $71 per share. It’s also worth noting that earlier this year, this same analysis yielded a long-term target at around $105.50 per share
Technical Profile
Here’s a look at the stock’s latest technical chart.
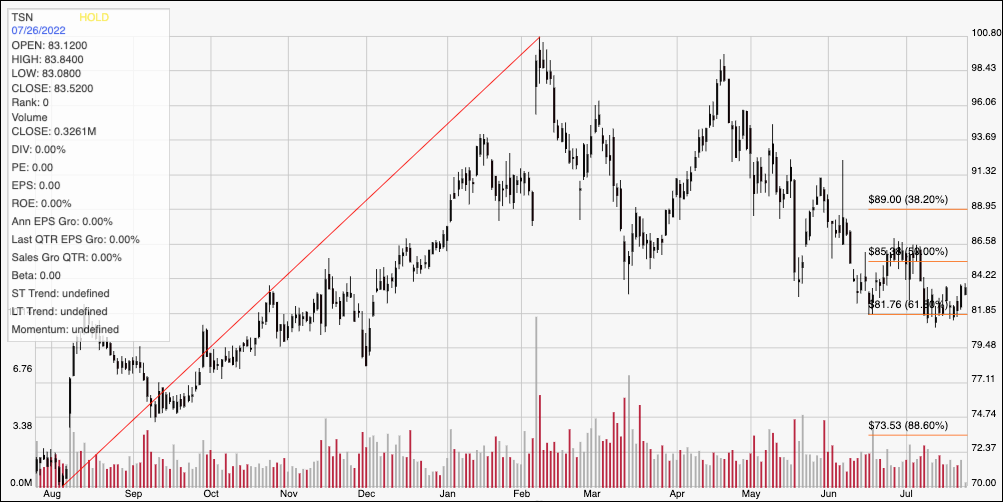
Current Price Action/Trends and Pivots: The diagonal red line outlines the stock’s upward trend from August 2020 beginning at around $70 and tracing to its high in February at around $100. It also provides the baseline for the Fibonacci retracement lines shown on the right side of the chart. From mid-April until now, the stock’s bearish momentum has put the stock in a clear downward trend, but it looks to have found current support at around the 61.8% retracement line, which is right around $82 per share, with immediate resistance at around $86.50 in the area of the 50% retracement line. A drop below $82 could see the stock fall to around $78 before finding next support, while a push above $86 should find next support at $89 where the 38.2% retracement line sits, and additional upside to about $91 if buying activity picks up.
Near-term Keys: TSN’s current downward trend hasn’t pushed the stock far enough yet to mark a useful value proposition. If you prefer to work with short-term term trading strategies, you could use a push above $86 as a signal to buy the stock or work with call options, with a useful, initial profit target at around $89 and $91 if bullish momentum accelerates. A drop below $82 could offer a signal to consider shorting the stock or buying put options, using $78 as a practical profit target on a bearish trade.