One of the big recovery stories over the past year or so has come from the Aerospace industry, which includes commercial airlines. From a disastrous 2020, and the first part of 2021, this is a sector that was radioactive not so long ago.
The “reopening” theme that became a part of market commentary in the second half of 2021 meant looking for pockets of the economy where the relaxation of pandemic-driven social restrictions would translate to useful increases in economic activity. A lot of economists and analysts pointed at this industry as one to watch, since many were predicting a recovery in travel demand as consumers started to exercise long-pent-up desires to get out, take vacations, and see family and friends.
There are two principle commercial airline producers in the world, which is where a proper examination of the Airline industry should start. Those companies are Boeing and Airbus. Both of these producers rely on production of engines and other components from a variety of suppliers to assemble their products, which is why what is good for these companies is also good for the industry. A boost in travel demand in 2021 and this year have paved the way for both of these companies to ramp up their own production, and by extension increase their orders from their respective suppliers. That’s a positive – but headwinds also exist, like all other sectors of the market, for this industry in the form of inflation and all of its resulting effects.
This year’s market volatility has been characterized by inflation, the reality of rising interest rates, and questions about how long the Fed will maintain the aggressive pace it has followed so far in 2022. Those are current issues that can’t be dismissed (even as some pundits are predicting that, following the Fed’s latest increase and statement, that rates will begin flattening), but being a contrarian by nature often means looking past current pressures and thinking about much longer-term trends. That normally means that industries that have been out of favor, but look like they could be in position to recover, start to naturally look a bit more attractive, especially in the long term. Many of the most well-known, commercial airlines in the Aerospace industry were hammered by the collapse in consumer and business travel, with modest gains since the second half of 2021, with some indications that demand is beginning to approach pre-pandemic levels. That is a significant tailwind that I think could help some of Airbus and Boeing’s suppliers thrive. Raytheon Technologies Corp. (RTX) is an example.
In the commercial airline segment, RTX’s biggest customer isn’t Boeing – it’s Airbus, which before COVID-19 became a global issue was drawing a number of Boeing customers to its business in the wake of the MAX grounding. RTX is also a major player in the government-funded Defense space, which has historically proven to be resilient and even resistant to economic downturns. The pandemic proved the value of RTX’s Defense business, as 2021’s earnings reports demonstrated that segment backstopped the entire company, putting it in position to recover more quickly than other companies whose businesses are closely tied to Boeing.
Strength in their Defense business didn’t completely offset Commercial travel losses in 2020, but they did nonetheless help their balance sheet absorb the hit better than a lot of other businesses, in this industry and others. The company completed a merger in April of 2020 with Raytheon, which increased its defense and intelligence business to nearly 60% of annual revenues. That gives RTX a backstop of revenue and cash flow that has enabled it to exercise patience with its commercial business, and that most other companies in the industry probably don’t have. I also believe another likely, long-term tailwind lies in the grim reality of the war in Ukraine. Regardless of the eventual outcome of that conflict, I expect tension between Russia and the West to remain higher than it has been in a generation, which also implies that military spending will increase, for the U.S. and other NATO nations.
While RTX has largely underperformed this year, falling from an April high at around $106 to about $81 in September, the stock has been rallying for the last month, rising abut 14% to its current level at around $96 per share. Are the company’s fundamentals still strong enough to make the stock a useful at its current price? Let’s find out.
Fundamental and Value Profile
Raytheon Technologies Corp, formerly, United Technologies Corporation is engaged in providing high technology products and services to the building systems and aerospace industries around the world. The Company operates through segments such as Pratt & Whitney and Collins Aerospace Systems. The Pratt & Whitney segment supplies aircraft engines for the commercial, military, business jet and general aviation markets. Pratt & Whitney segment provides fleet management services and aftermarket maintenance, repair and overhaul services. The Collins Aerospace Systems segment provides aerospace products and aftermarket service solutions for aircraft manufacturers, airlines, regional, business and general aviation markets, military, space and undersea operations. RTX has a current market cap of $141 billion.
Earnings and Sales Growth: Over the last twelve months, earnings decreased by about -4%, while sales were 4.55% higher. In the last quarter, earnings grew by 4.3% while Revenues were 3.9% higher. RTX’s Net Income versus Revenue over the last year was 6.76%, and strengthened in the last quarter to 8.18% to offer an interesting counter for the declining earnings picture over the last year.
Free Cash Flow: RTX’s Free Cash Flow has been declining over the last year. In the last quarter, free cash flow was a little over $3.3 billion from about $5 billion a year ago. In the quarter prior, this number was about $4.55 billion. The current free cash flow number translates to a modest Free Cash Flow Yield of 2.34%.
Debt to Equity: RTX has a debt/equity ratio of .43, which is very conservative, and marks a drop from 1.03 in the first quarter of 2020. Their balance sheet shows about $5.4 billion (versus $4.7 billion in the last quarter) in cash and liquid assets against $31 billion in long-term debt (versus $45.3 billion at the end of the first quarter of 2020). Servicing their debt is no problem.
Dividend: RTX pays an annual dividend of $2.20 per share, which at its current price translates to a yield of 2.29%. It should be noted that early in 2020, management announced it was reducing the dividend from $2.94 to $1.90 per share, a cost-cutting measure that can be interpreted as positive or negative depending on your general view. Management raised the dividend in 2021 to $2.04, and then again to its current level at the beginning of this year, which I take as a sign of increasing confidence and strength.
Price/Book Ratio: there are a lot of ways to measure how much a stock should be worth; but I like to work with a combination of Price/Book and Price/Cash Flow analysis. Together, these measurements provide a long-term, fair value target around $93 per share, which suggests that the stock is slightly overvalued at its current price, by about -3%, with a useful discount price at around $75.
Technical Profile
Here’s a look at the stock’s latest technical chart.
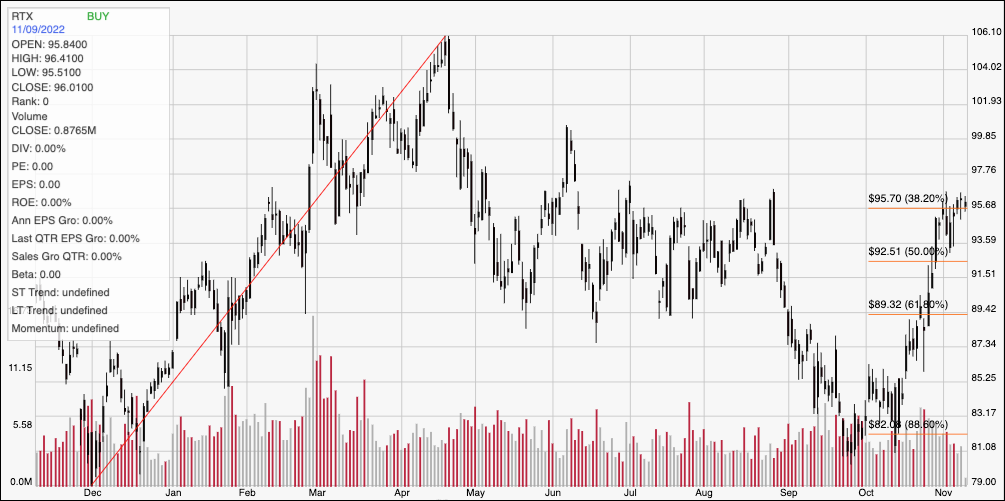
Current Price Action/Trends and Pivots: The red diagonal line follows the stock’s upward trend from its December 2021 low to its peak, reached in April at around $106 per share. It also provides the baseline for the Fibonacci retracement lines on the right side of the chart. After following an extended downward trend from that peak, the stock bottom in September at around $81 and begin rallying strongly from that point in October. As of this writing, the stock has pushed above all three major Fibonacci retracement levels and is sitting right on current support at around $95.50 where the 38.2% retracement line can also be seen. Immediate resistance should be at around $98, with additional upside to about $100 if buying momentum continues. A drop below support at $95.50 should find next support at around $91.51, a little below the 50% retracement line and consistent with pivot activity seen in that price area at different points throughout the summer.
Near-term Keys: RTX’s balance sheet has remained generally solid throughout the past year, despite the headwinds in its commercial business that may be starting to turn in the company’s favor. The company’s operations in the Defense space, along with aggressive cost-cutting measures it took during the early stages of the pandemic in its commercial business should also continue to provide additional momentum moving forward. Despite those positives, the stock’s latest rally has moved the stock past the point of useful value. If you prefer to focus on short-term trading strategies, a drop below $95.50 could be a good signal to consider shorting the stock or buying put options, using $91.50 as an practical bearish trade target, while continued momentum above $96 could be a good signal to buy the stock or work with call options, with upside to about $98.50 on a bullish trade, and possibly $100 if buying momentum accelerates.