Trying to keep a thumb on the pulse of the market is an inexact science at best. I’ve learned to start by narrowing my focus on a single industry or sector, and then work outward.
One of the sectors that I have learned to pay attention to as a starting point to find the temperature of the economy in general is the Materials sector. That’s because the companies that comprise it produce or mine many of the raw materials that make up the building blocks for most of the finished goods we use every day. The sector includes industries that cover chemicals and plastics, construction materials, paper, forest, and packaging products, and even metals and minerals – which means that in some form, this sector touches practically every other segment of the economy in one form or another.
Since 2022 started, the market’s volatility has increased along with inflation and interest rate, and have been compounded by the war in Ukraine that shows no signs of peaceful resolution in the foreseeable future. During that time, stocks in the Materials sector have certainly not been immune to the broad market’s momentum. And even though the broad market has staged a pretty significant rally since the middle of October, the challenges that have driven the market’s momentum for most of the year seem likely to remain in place. That means they could continue to act as a headwind to blunt the pace of economic growth that has so far prompted the Fed to implement aggressive, incremental interest rate increases throughout the year. Whether these varying elements will be a positive, or a negative for the Materials sector depends, I think on the specific niche a company operates in and their exposure to larger commodity movements.
Huntsman Corp (HUN) is a company that has benefitted from a homebuilding industry that saw a surprising level of robustness in 2020 and 2021, as residential construction saw big increases in numerous parts of the country. From its bear market low in March at around $12, the stock more than doubled in price by the end of 2020, and peaked in late February of this year at almost $42. From that point, however, the stock has followed broad market momentum downward, hitting its most recent low point in late September at around $23.50. The stock has been rallied from that point, and is a little below $29 as of this writing. The stock’s big decline – more than -38% from its February peak – contrasts against a fundamental profile that includes increasing cash flow and a healthy balance sheet. Contrasted against that fundamental backdrop, the stock’s price activity over the last month and a half begs the question of whether the stock might offer a useful value proposition, along with a nice technical bullish signal to think about. Let’s dive in.
Fundamental and Value Profile
Huntsman Corporation is a manufacturer of differentiated organic chemical products and of inorganic chemical products. The Company operates all of its businesses through its subsidiary, Huntsman International LLC (Huntsman International). The Company operates through five segments: Polyurethanes, Performance Products, Advanced Materials, Textile Effects, and Pigments and Additives. Its Polyurethanes, Performance Products, Advanced Materials and Textile Effects segments produce differentiated organic chemical products and its Pigments and Additives segment produces inorganic chemical products. The Company’s products are used in a range of applications, including those in the adhesives, aerospace, automotive, construction products, personal care and hygiene, durable and non-durable consumer products, digital inks, electronics, medical, packaging, paints and coatings, power generation, refining, synthetic fiber, textile chemicals and dye industries. HUN’s current market cap is $5.5 billion.
Earnings and Sales Growth: Over the last twelve months, earnings declined -34%, while revenues also shrank by about -12%. In the last quarter, earnings were -44.5% lower while revenues declined by nearly -15%. HUN’s operating profile is experiencing some deterioration as of the most recent earnings report. In the last year, Net Income was 12.66% of Revenues, but weakened to 4.97% in the last quarter. This is a pattern that has extended over the last six months, which is a red flag.
Free Cash Flow: HUN’s free cash flow is $1.1 billion. This marks an improvement over the last year, when Free Cash Flow was $610 million, and $986 million in the last quarter. The current number translates to a useful Free Cash Flow Yield of 20.37%. It is also noteworthy that HUN’s Free Cash Flow saw a peak at $1.2 billion in June 2018, and has declined from that point, but the turn over the last year from negative territory, along with healthy liquidity compared to debt provides a useful counter to the current Net Income pattern and could signal that the company has successfully navigated that storm.
Debt to Equity: HUN has a debt/equity ratio of .37. This is a conservative number that has also decreased since the beginning of 2020 from .77. HUN’s balance sheet shows that total cash in the last quarter was about $515 million (down from $1.04 billion a year ago), while long-term debt is $1.475 billion. Debt service is not a concern given the company’s healthy Free Cash Flow and a balance sheet that remains healthy even with its drop over the last year.
Dividend: HUN pays an annual dividend of $.85 per share, which translates to an annual yield of about 2.98% at the stock’s current price. It is also worth noting that management increased the dividend at the beginning of the year, from $.75 per share, and from $.65 per share earlier in 2021.
Price/Book Ratio: there are a lot of ways to measure how much a stock should be worth; but I like to work with a combination of Price/Book and Price/Cash Flow analysis. Together, these measurements provide a long-term, fair value target at around $45.50 per share. That suggests that at its current price, the stock is undervalued by about 59%.
Technical Profile
Here’s a look at the stock’s latest technical chart.
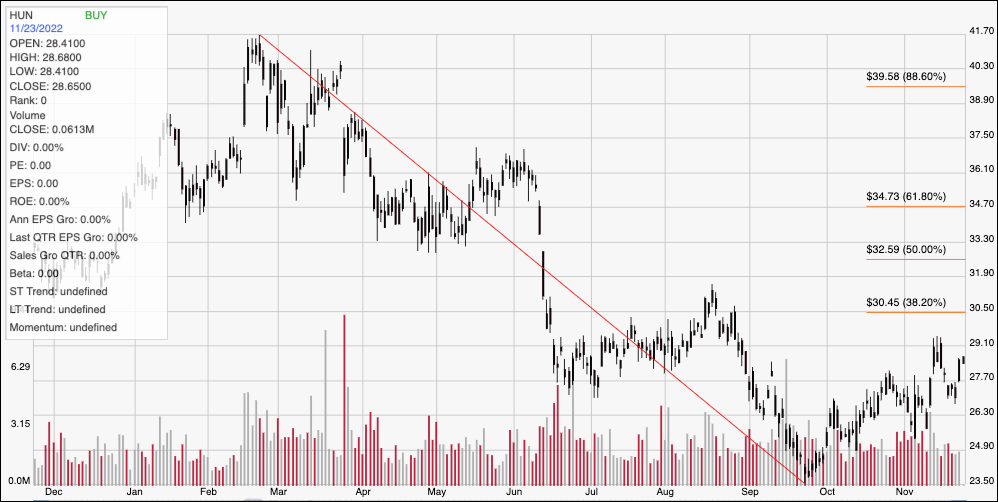
Current Price Action/Trends and Pivots: The diagonal red line on the chart above traces the stock’s downward trend from a peak at around $42 in February of this year to its low point around $23.50, reached in late September. It also provides the baseline for the Fibonacci retracement lines shown on the right side of the chart. Since hitting that latest, 52-week low, the stock has rallied to its most recent pivot high at around $29 earlier this month. The stock is a bit off of that peak, marking immediate resistance at $29, with current support close by at around $28. A push above $29 should find next resistance at around $31, based on a pivot high in mid-August at that level, while a drop below $28 could see downside to about $26 before finding next support.
Near-term Keys: HUN has developed an interesting, bullish short-term trend, which could mean that if you prefer to focus on short-term trading strategies, a push above $29 could offer a signal to buy the stock or work with call options, with $31 offering a practical, near-term profit target. A drop below $28 could be a signal to consider shorting the stock or buying put options, using $26 as a useful initial profit target on a bearish trade and $25 possible if selling activity increases. The company’s fundamentals support HUN as a very interesting value at its current price, which means that if you’re willing to accept the potential for continued, high volatility in the market right now, this could be an interesting long-term opportunity.