Inflation, rising interest rates, and all of the economic uncertainty that comes with them puts a lot of pressure on industries that are associated with consumer demand. That includes the Auto industry.
The last few years have seen a lot of turmoil for auto manufacturers. The pandemic shuttered economic activity, and collapsed oil prices as well as demand for new autos. Unprecedented economic stimulus during the pandemic also gave consumers a lot of extra cash to burn, so when economic activity began to reopen, those same consumers began looking for new purchases, including autos. That increase in demand, however contrasted against supply chain challenges to push new and used auto prices higher in 2021 and most of this year.
Another intriguing element at play for automakers in general, and certainly for the biggest U.S. players is the shift towards electrical vehicles. Both Ford and General Motors (GM) are shifting their focus away from traditional combustion engines over time to all-electrical vehicles only. That is a shift that makes sense given the big push in consumer preferences in that direction as well as the emergence of EV manufacturers like Tesla, Nikola, and others.
For GM, 2022 has marked some major improvements in its fundamental profile that have diverged from the market’s treatment of its stock price. From a January peak at around $67, the stock tumbled more than -50% to a July low at around $30 per share. The stock has staged a couple of temporary rallies since then, but has failed to maintain any momentum above $40, and is now sitting in a consolidation range between about $36 and $41. What does its divergence between fundamental strength and price mean for the stock’s value proposition? Let’s dive in.
Fundamental and Value Profile
General Motors Company designs, builds and sells trucks, crossovers, cars and automobile parts and provides software-enabled services and subscriptions worldwide. The Company provides automotive financing services through its General Motors Financial Company, Inc. (GM Financial) segment. GM North America (GMNA) and GM International (GMI) develops, manufactures and/or markets vehicles under the Buick, Cadillac, Chevrolet and GMC brands. The Company’s segments include GMNA, GMI, Cruise and GM Financial. Its Cruise segment is engaged in the development and commercialization of autonomous vehicle technology. It offers OnStar and connected services to approximately 22 million connected vehicles globally through subscription-based and complimentary services. It is also developing hydrogen fuel cell applications across transportation and industries, including mobile power generation, class seven/eight truck, locomotive, aerospace and marine applications. GM’s current market cap is $54.4 billion.
Earnings and Sales Growth: Over the last twelve months, earnings increased by more than 48%, while sales were 56.4% higher. In the last quarter, earnings increased by more than 97% while sales were more than 17% higher. GM’s margin profile is showing signs of strength. Net Income over the last twelve months was 6.57% of Revenues, and increased in the last quarter to 7.87%.
Free Cash Flow: GM’s free cash flow is healthy, at about $24.6 billion for the trailing twelve month period. That translates to an outsized Free Cash Flow yield of 45.3%. By comparison, Free Cash Flow was -$1.7 billion in the quarter prior, $5.7 billion nine months ago and $7.5 billion a year ago. The reversal from negative Free Cash Flow is notable, but the size of the increase begs the question of its sustainability.
Debt to Equity: GM has a debt/equity ratio of 1.11, a high number that indicates that, like most companies in this industry, the company operates with a high degree of leverage. GM’s balance sheet is a source of strength, with cash and liquid assets of about $30.3 billion (up from $26.8 billion in the last quarter and $28.6 billion a year ago) against $77.5 billion in long-term debt. The company’s sizable Free Cash Flow, healthy cash position and improving operating profile indicate that while their debt is high, servicing it isn’t a problem.
Dividend: GM pays a dividend of $.36 per share, per year, and which translates to an annualized dividend yield of .94% at the stock’s current price. Management suspended the dividend in 2020 in response to COVID and reinstated it after the third quarter of this year, which is a sign of confidence on the part of management in their path ahead.
Price/Book Ratio: there are a lot of ways to measure how much a stock should be worth; but I like to work with a combination of Price/Book and Price/Cash Flow analysis. Together, these measurements provide a long-term, fair value target around $60 per share. That means that GM is significantly undervalued, with about 57% upside from its current price.
Technical Profile
Here’s a look at the stock’s latest technical chart.
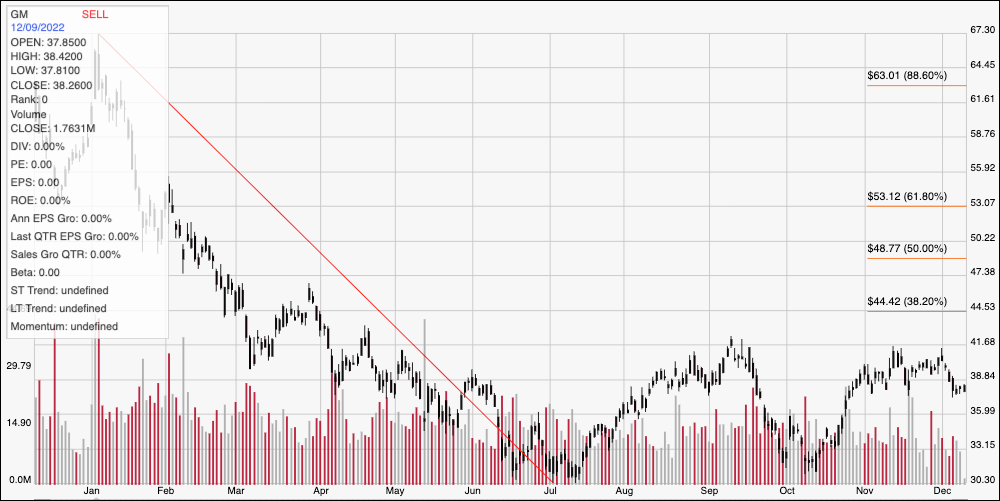
Current Price Action/Trends and Pivots: The chart above displays the stock’s price activity over the last year. The red diagonal line traces the stock’s downward trend from its January high at around $67 to its July low at around $30. It also provides the baseline for the Fibonacci retracement lines shown on the right side of the chart. The stock has staged two rallies off of that yearly low over the last five months, with the latest bounce starting in October and peaking at about $41 per share to mark immediate resistance at that level. The stock has also hovered around current support in the $38 price area, which is near to the stock’s current price. A push above $41 should find next resistance at about $44.50, where the 38.2% retracement line sits, while a drop below $38 should find next support at about $35 per share.
Near-term Keys: While GM has some very interesting fundamental strengths in its favor, and a value proposition that looks very tempting, I think the current economic climate adds a level of uncertainty that adds a level of risk of which average investors should exercise caution. Even with those economic concerns in mind, I think GM is a stock that is worth putting in a watchlist and coming back to If you prefer to work with short-term trading strategies, you could use a break above $41 could be a signal to buy the stock or to work with call options, using $44.50 as a useful target price on a bullish trade. A drop below $38 could offer a signal to think about shorting the stock or working with put options, using $35 as a practical profit target on a bearish trade.