For investors, the holiday season generally marks a time when consumer activity should be healthy and demand for consumer goods will be high. That’s a big reason that in the latter part of the year, as the colder months set in across the country, that retail stocks often start to see healthy increases in prices.
The idea that the end of the year is good for retail industries is, of course, a broad generalization that is also subject to the variability of economic health from one year to the next, which can of course be heavily influenced by global, macroeconomic considerations, political influences and any number of other factors. As we wrap up 2022, most of the major threads that have dictated market action and direction are still very much in the forefront. The war in Ukraine hasn’t abated, keeping geopolitical tensions high and pressuring commodity prices on everything from grains to energy products. Inflationary indicators remain elevated around the globe, prompting central banks to move in near-lockstep in raising interest rates on an aggressive basis, with little actual indications that increases are near an end. Also not to be dismissed is the practical reality that, even three years in, COVID is still very much a thing.
The ripple effect of all of these various forces on the broad economy can interestingly be seen pretty clearly in the movement of some of the biggest, national retailers in the United States. For both (WMT) and Target Corp (TGT), for example, these companies enjoyed significant increases in their stock prices through 2021. As some of the inflationary pressures I just outlined began to be felt at the consumer level, however in 2022, these stocks also began to come under increasing pressure. TGT, for example managed to hold around its late 2021 high in the $250 per share range through May of this year, before rising costs and other pressures prompted investors to start dumping shares, pushing the stock to a yearly low in July at around $140 per share. With the Fed’s latest rate increase, and other indications clearly showing that inflation is still high, TGT has dropped from a temporary peak at around $167 at the end of November to begin approaching that yearly low again.
TGT is an interesting company that has managed to forge its own solid spot as a major national player in the retail industry even as competition in the space has greatly intensified. This is a company that, like WMT experienced healthy improvements in its bottom line in 2020 as they successfully navigated the health crisis, in part by being one of a small handful of “big box retailers” still standing after years of consolidation, and also by expanding the availability and use of the increasingly important omnichannel marketing and commerce strategies that put a big emphasis on online capability. With the stock down more than 34% this year, of course the question becomes whether those fundamentals are strong enough to translate to a useful value price for one of the most recognizable U.S. retailing names? Let’s try to find out.
Fundamental and Value Profile
Target Corporation (Target) is a general merchandise retailer selling products through its stores and digital channels. Its general merchandise stores offer an edited food assortment, including perishables, dry grocery, dairy and frozen items. Its digital channels include a range of general merchandise, including a range of items found in its stores, along with an assortment, such as additional sizes and colors sold only online. Its owned brands include Archer Farms, Market Pantry, Sutton & Dodge, Art Class, Merona, Threshold, Ava & Viv, Pillowfort, Room Essentials, Wine Cube, Cat & Jack, Simply Balanced and Wondershop. Its exclusive brands include C9 by Champion, Hand Made Modern, Mossimo, DENIZEN from Levi’s, Nate Berkus for Target, Fieldcrest, Kid Made Modern, Genuine Kids from OshKosh and Liz Lange for Target. As of January 28, 2017, the Company had 1,802 stores across the United States, including 1,535 owned stores, 107 leased stores and 160 owned buildings on leased land. TGT’s current market cap is $67.2 billion.
Earnings and Sales Growth: Over the last twelve months, earnings declined more than -49%, while sales increased by about 3.4%. In the last quarter, earnings increased by nearly 295% while revenues increased 1.85%. Like most stocks in this sector, the company operates with a narrow margin profile that does show some weakness in the last few months. As a percentage of Revenues, Net Income was 3.17% in the last year, and decreased to 2.68% in the last quarter.
Free Cash Flow: TGT’s free cash flow has declined sharply over the last year, falling into negative territory, at -$1.8 billion as of the last quarter. A year ago, this number was about $5.1 billion. The decline, along with the decrease in Net Income and declining liquidity (see below), I take as a red flag that needs correcting to make the stock’s fundamentals more appealing.
Debt to Equity: TGT has a debt/equity ratio of 1.29. This is a higher number than I generally prefer to see, and implies the company is heavily leveraged. As of the last quarter, management reported with $954 million in cash and liquid assets against about $14.2 billion in long-term debt. Cash has declined from about $1.1 billion two quarters ago and $5.9 billion in a year ago. It’s also worth noting that in mid-2021, cash was around $7.4 billion.
Dividend: TGT pays an annual dividend of $4.32 per share, which translates to an annual yield of about 2.83% at the stock’s current price.
Price/Book Ratio: there are a lot of ways to measure how much a stock should be worth; but I like to work with a combination of Price/Book and Price/Cash Flow analysis. Together, these measurements provide a long-term, fair value target around $39 per share. That means the stock is clearly, significantly overvalued, with -73% downside from its current price, and a practical discount price at around $31.
Technical Profile
Here’s a look at the stock’s latest technical chart.
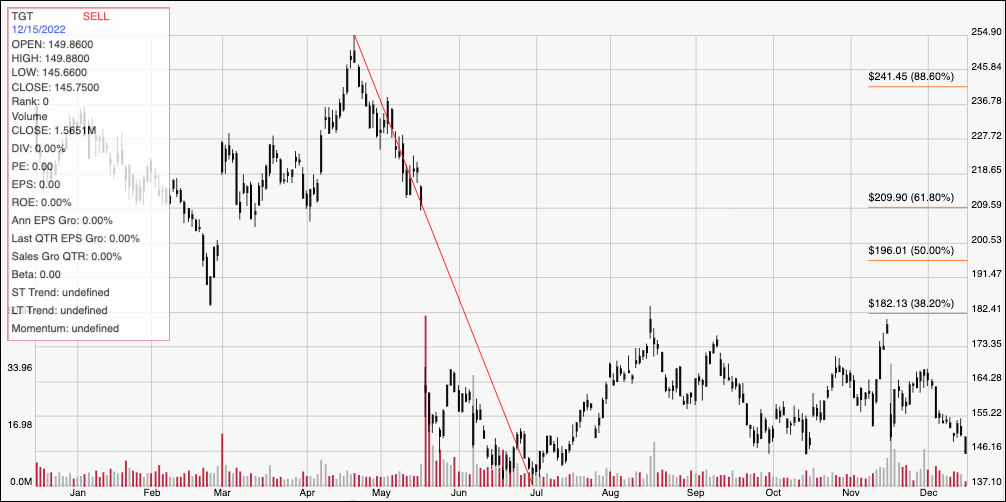
Current Price Action/Trends and Pivots: The chart above displays TGT’s price action over the last year. The red diagonal line plots the stock’s downward trend from its April high at around $255 to its low in July at around $137. It also provides the baseline for the Fibonacci retracement lines shown on the right side of the chart. The stock has mostly consolidated at the low end of that trend since July, with its consolidation range tightening right now to about $155 for immediate resistance at $146 for current support. A push above $155 should have near-term upside to about $164 before finding next resistance, while a drop below $146 should retest the July low around $137.
Near-term Keys: Without a useful value proposition anywhere in sight (the stock’s realistic bargain value price is about $115 below the stock’s current price), the most interesting opportunities to work with TGT lie in the potential short-term trading opportunities it could offer. If the stock breaks above immediate resistance at $155, it could offer a useful signal to buy the stock or use call options, using $164 as an interesting exit target. A drop below $146 could be a good signal to short the stock or buy put options, using $137 as a practical bearish profit target.