For retail stocks, one of the things that a lot of investors look forward to is the typical, “Santa Claus Rally” leading up to Christmas. It makes sense, since holiday shopping is at its peak. That hasn’t really been the way things have turned out this year.
After surging from a bear market low in October, the broad market peaked to start this month and has been picking up bearish momentum as economic indicators show the U.S. economy is moderating, but not really slowing down. That strength is despite seven increases by the Federal Reserve in interest rates, including the latest one. For the market, the dagger seems to have come not from the increases themselves, but by Fed Chair Jay Powell’s comments about the central bank’s target interest rate and how long they think rates will remain high.
An increasingly hawkish central bank means that monetary policy is likely to remain restricted for the foreseeable future, as Fed governors are determined to rein in inflation and bring economic activity back down to more sustainable long-term levels. Whether their current strategy to bring that off, will actually accomplish that goal, or simply push the economy into another recession is the centerpiece, I believe in what is driving market volatility at the moment.
No matter what current market conditions may be at any given time, one of the primary questions any long-term focused investor – whether you prefer a growth or value approach – should be whether the strength of the underlying business is strong enough to justify a stock’s current price. For value-oriented investors, the question is somewhat contradictory, since the question revolves around determining how to translate a company’s fundamental strengths into a useful price-based reference, against which you can then compare the stock’s current price. The value question tends to become more complicated when a stock has followed a long-term upward trend, with indications that it could continue doing so like a generally healthy economy, lower-trending unemployment, and a generally robust consumer environment.
Walmart Inc. (WMT) is one of the most recognized consumer-driven names in the world, and are generally recognized – along with Amazon – as being the de facto leader in the retail world. Even as AMZN has made its own inroads over the last two decades in the retail space, WMT has kept pace, with the two companies essentially establishing the baseline against which all other companies are measured. That is true no matter whether you’re talking about brick-and-mortar stores, where WMT may be most easily identified, or online retailing. While AMZN has been the clear leader in that space, WMT has moved aggressively to compete, and generally been successful. 2022 has seen market volatility and uncertainty play out in WMT’s stock price, as it dropped quickly in May of this year from its yearly high above $160 to a low around $117. The stock has followed a useful upward trend from that point, but as December started, the stock has dropped again off its latest peak at around $154 and appears to be picking up new bearish momentum. Are the fundamentals strong enough to suggest the stock could offer an attractive value, or has the stock’s rally over the last seven months pushed the stock past the point of useful value? Let’s find out.
Fundamental and Value Profile
Walmart Inc is engaged in the operation of retail, wholesale and other units, as well as eCommerce, located throughout the United States, Africa, Canada, Central America, Chile, China, India and Mexico. The Company offers an assortment of merchandise and services at everyday low prices (EDLP). The Company operates through three segments: Walmart U.S., Walmart International and Sam’s Club. The Walmart U.S. segment includes the Company’s mass merchant concept in the United States. The Walmart International segment consists of the Company’s operations outside of the United States. The Sam’s Club segment includes the warehouse membership clubs in the United States. The Company operates approximately 10,500 stores, clubs and eCommerce Websites under 48 banners in 24 countries. WMT’s current market cap is $388.7 billion.
Earnings and Sales Growth: Over the last twelve months, earnings and sales have increased, with earnings increasing about 3.45%, and sales growing about 8.74%. In the last quarter, earnings declined by -15.25% while revenues were flat, but slightly negative at -0.03%. Like most stocks in this sector, the company operates with an extremely narrow margin profile that has weakened in the last few months. As a percentage of Revenues, Net Income was 1.49% in the last year, and declined to -1.18% in the last quarter. The drop to negative Net Income is a significant red flag.
Free Cash Flow: WMT’s free cash flow is modest, and has been declining over the past year, from about $11.5 billion a year ago to $7.2 billion in the last quarter. The current number translates to a Free Cash Flow Yield of 1.85%.
Debt to Equity: WMT has a debt/equity ratio of .48. This is a conservative number. They also have generally healthy liquidity, with $11.6 billion in cash and liquid assets (down from $14.7 billion a year ago) against $33.9 billion in long-term debt. The company’s operating profits are sufficient to service the debt they have, however any sustained pattern of negative Net Income could challenge WMT’s financial flexibility as cash will be further drawn down in debt service.
Dividend: WMT pays an annual dividend of $2.24 per share, which translates to an annual yield that of about 1.54% at the stock’s current price.
Price/Book Ratio: there are a lot of ways to measure how much a stock should be worth; but I like to work with a combination of Price/Book and Price/Cash Flow analysis. Together, these measurements provide a long-term, fair value target around $87 per share. That means the stock is clearly overvalued, with -40% downside from its current price, and a practical discount price at around $69.50. It is also worth noting that a year ago, this same analysis yielded a fair value target at around $104 per share.
Technical Profile
Here’s a look at the stock’s latest technical chart.
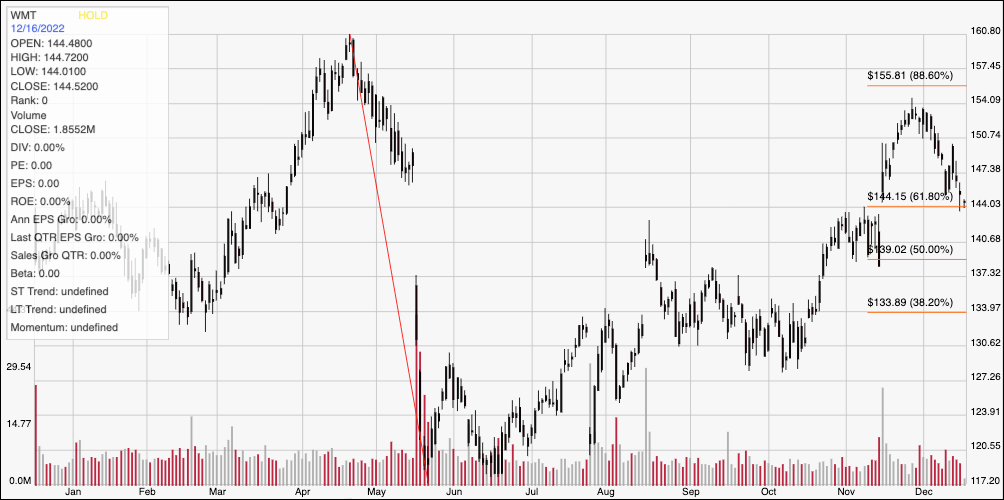
Current Price Action/Trends and Pivots: The chart above displays WMT’s price action over the last year. The red diagonal line plots the stock’s downward trend from an April peak at around $161 to its low in May at around $117. It also provides the baseline for the Fibonacci retracement lines shown on the right side of the chart. The stock has followed a clear upward trend from that low, but most recently hit a peak at around $154 at the end of November to mark immediate resistance at that level. The stock is also approaching expected, current support at around $144 where the 61.8% line sits. A drop below $144 could see near-term downside to about $139, where a lot of pivot activity can be seen in early November as well as the 50% retracement line. A push above $154 should give the stock room to retest its 52-week high at around $161.
Near-term Keys: Without any kind of useful value proposition right now, the most interesting opportunities to work with WMT lie in the potential short-term trading opportunities it could offer. A bounce off of current support at $144 could be a good opportunity to buy the stock or work with call options, with a useful target price at around immediate resistance at $154, or $161 if bullish momentum accelerates. A drop below $144 could offer a useful bearish trade by either shorting the stock or buying put options, with $139 offering a practical, near-term target price and additional downside to about $134 (around the 38.2% retracement line) if bearish activity picks up.