With persistently high inflation that has kept interest rates rising throughout the year, economically sensitive industries have been the most vulnerable. The Consumer Discretionary sector is a perfect example.
As reflected by the S&P 500 Consumer Discretionary Sector SPDR (XLY), the sector has followed the broad indices into its own bear market. This is a sector that includes a wide swath of business types typified by products and services of which consumers tend to buy less when economic conditions become more difficult. High inflation that creates a rising interest rate environment are exactly the kind of conditions that usually work against in this sector that typically includes specialty retailers and their suppliers.
As we move in to a new year, some analysts have pointed to historical precedent to suggest that 2023 could see better times. For example, history shows that 80% of the time, in the year following a full year of bear market activity, the market rallies to begin a new bull market. Those sound like pretty good odds for a market rebound at some point in 2023. My own analysis of historical bear markets differs somewhat from that optimistic appraisal, but only in the sense that in the past five decades, bear markets tend to cover at least eighteen months of time. We’re only now moving into month twelve of the current bear market, which means that while we may see a market rebound and shift back to positive territory next year, it doesn’t seem likely to come until at least the second half of the year. That strongly suggests that the bottom hasn’t come in yet, which is one more reason that I don’t believe it’s time to start going all-in on new buying opportunities just yet.
While most growth-oriented investors will avoid cyclically-sensitive stocks under current market conditions, the flip side is that companies in these sectors, which in many cases have already dropped into their own bear markets, eventually find a level at which value investors start to sit up and take notice. If the company has the underlying fundamental strength to also suggest that their long-term value opportunity is significantly higher, the argument for thinking about “swimming against the tide” of popular opinion starts to become compelling.
PVH Corp (PVH) is a good example. This is a stock that has well over -50% from its high in late 2021 at around $125 to its low in September at around $43.50. That made the stock one of the loss leaders in the sector over that period, however from that point the stock rallied, hitting its most recent peak earlier this month at around $76. Bolstering that move, at least in part is the fact that even in a broadly difficult economic environment, the company boasted a solid balance sheet, useful free cash flow, and a dividend that was reinstated earlier this year after having been suspended during the worst of the coronavirus pandemic. Are those positive fundamentals still in place as we close out 2022 and move into 2023? And are still strong enough to make the stock a useful value-oriented opportunity right now, or has the latest rally pushed the stock past the point of useful value? Let’s find out.
Fundamental and Value Profile
PVH Corp. is an apparel company. The Company operates through three segments: Calvin Klein, which consists of the Calvin Klein North America and Calvin Klein International segments; Tommy Hilfiger, which consists of the Tommy Hilfiger North America and Tommy Hilfiger International segments, and Heritage Brands, which consists of the Heritage Brands Wholesale and Heritage Brands Retail segments. The Company’s brand portfolio consists of various brand names, including Calvin Klein, Tommy Hilfiger, Van Heusen, IZOD, ARROW, Warner’s, Olga and Eagle, which are owned, and Speedo, Geoffrey Beene, Kenneth Cole New York, Kenneth Cole Reaction, Sean John, MICHAEL Michael Kors, Michael Kors Collection and Chaps, which are licensed, as well as various other licensed and private label brands. The Company designs and markets dress shirts, neckwear, sportswear, jeanswear, intimate apparel, swim products and handbags, footwear and other related products. PVH has a current market cap of $4.4 billion.
Earnings and Sales Growth: Over the last twelve months, earnings decreased about -2.6%, while sales also dropped by -2.2%. In the last quarter, earnings improved by 25%, while revenues increased by nearly 7%. The company’s margin profile is a concern, and reflects broader economic conditions that have raised inputs costs for companies throughout the economy; over the last twelve months, Net Income was 5.05% of Revenues and fell to -8.19% in the last quarter. Negative net income strongly implies the company is paying out more in expenses than they are bringing in from revenue.
Free Cash Flow: PVH’s Free Cash Flow has struggled over the past year, and has also dropped into negative territory, at -$79.7 million over the period. This is a number that has declined from $805 million a year ago.
Debt to Equity: PVH has a debt/equity ratio of .44, which is a very conservative number. Their balance sheet shows $457 million in cash and liquid assets against $2.1 billion of long-term debt. Cash has dropped from a little more than $1.2 billion a year ago, but it is also worth mentioning that at the beginning of 2020, long-term debt was about $4.2 billion. Their drop to negative Net Income along with negative Free Cash Flow, with declining liquidity raise the question of the company’s ability to service their debt.
Dividend: PVH pays an annual dividend of $.15 per share, which translates to a minimal dividend yield of just .21%. The stock’s dividend is not a defining reason to own the stock, but it is noteworthy that management suspended its dividend in 2020 to provide financial flexibility during the early stages of the pandemic, and reinstated it in the first quarter of this year.
Price/Book Ratio: there are a lot of ways to measure how much a stock should be worth; but I like to worth with a combination of Price/Book and Price/Cash Flow analysis. All together, these measurements provide a long-term target at about $58 per share. That suggests that the stock is overvalued, with about -16.5% downside from its current price.
Technical Profile
Here’s a look at the stock’s latest technical chart.
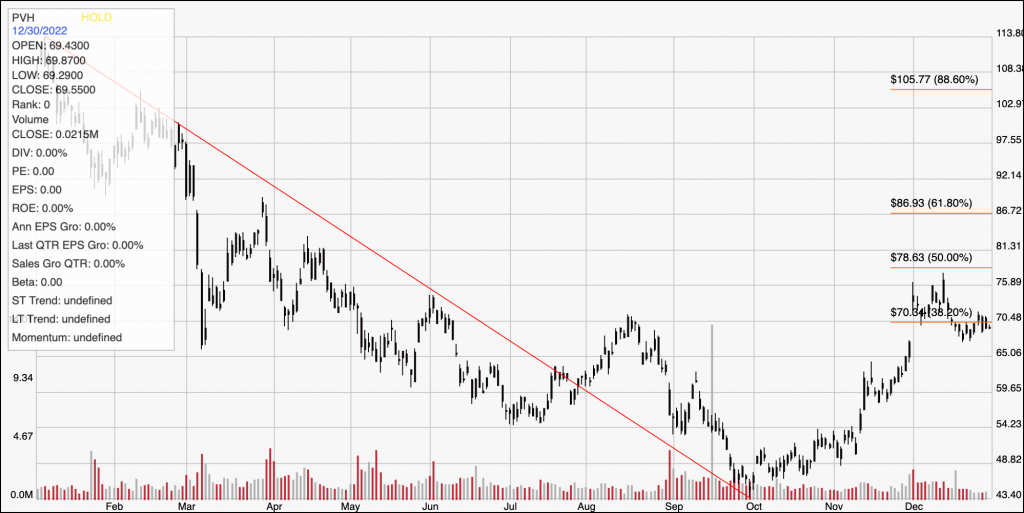
Current Price Action/Trends and Pivots: The chart above displays the last year of price performance for PVH. The red diagonal line traces the stock’s downward trend from a high at around $114 a year ago to its October low at about $43.50. It also provides the baseline for the Fibonacci retracement lines shown on the chart. After rallying to its latest peak this month at about $76, the stock has dropped back to hover right around the 38.2% retracement line, marking immediate resistance at about $71 and current support at around $68. A push above $71 could have short-term upside to about $76, while a drop below $68 should find next support at around $64.
Near-term Keys: Given the direction, and strength of the stock’s long-term trend, the stock’s rally over the last three months could mark the beginning of a new upward trend. That sounds like good news for growth-oriented investors, however the company’s declining fundamentals validate the fact that the stock doesn’t provide a good value-based opportunity right now. If you prefer to focus on short-term trading strategies, you could use a push above resistance at $71 as a signal to buy the stock or work with call options, with $76 acting as a practical bullish profit target. A drop below below $68 would be a good signal to consider shorting the stock or buying put options, with a target price at around $48 acting as a good profit point on a bearish trade.