No matter how tired we get of hearing about COVID-19, the truth is that it hasn’t gone away, and neither have the health concerns associated with it.
There is no denying that ever since the virus found its way to American shores almost three years ago, a lot of media attention has been given to the Healthcare sector – and especially to the Biotechnology industry. Besides vaccines and their booster follow-ups, anti-viral treatments also saw a significant push in development along with big demand.
Some of the names that showed early promise also received the most attention from analysts and media types, at least in the earliest stages of the pandemic. One of those companies is Gilead Sciences Inc. (GILD), a large-cap company with treatments for diseases such as HIV/AIDS, cancer, and other respiratory diseases. One of their antiviral drugs, remdesivir was originally created to combat the hepatitis C virus, but that demonstrated a significant enough benefit in clinical trials with hospitalized COVID patients to gain emergency approval from the FDA. Remdesevir (sold under the brand name Veklury) gave the company a revenue stream that in the most recent quarter represented about 13.5% of sales.
Outside of COVID-19, the company has also been investing heavily since 2019 to bolster its drug pipeline, with its acquisition of Immunomedics providing a newly approved treatment for metastatic triple-negative breast cancer that was approved by the FDA earlier this year and is expected to generate $3.5 billion in sales by 2025. GILD enjoys a dominant share of the HIV treatment market, which is expected to see long-term growth in the 2-3% range per year. Along with its cancer treatments, HIV treatment represents the second, primary leg of GILD’s long-term growth strategy. Those are net positives, especially as sales of Veklury as a percentage of GILD’s business have begun to fade.
Since finding a June 2022 low at around $57 per share, GILD’s stock price has been rallying, hitting a 52-week high at around $90 per share in November of last year. The stock has faded back from that high a bit, but is still only a few dollars away, with a consolidation pattern building since mid-December. Does that mean the stock has topped, and is due to drop back down again, or is it just a pause along the way to much longer upward trend? Where do the company’s fundamentals suggest the stock’s bargain price should be? Let’s see what we can find.
Fundamental and Value Profile
Gilead Sciences, Inc. is a research-based biopharmaceutical company that discovers, develops and commercializes medicines in areas of unmet medical need. The Company’s portfolio of products and pipeline of investigational drugs includes treatments for Human Immunodeficiency Virus/Acquired Immune Deficiency Syndrome (HIV/AIDS), liver diseases, cancer, inflammatory and respiratory diseases and cardiovascular conditions. Its products for HIV/AIDS patients include Descovy, Odefsey, Genvoya, Stribild, Complera/Eviplera, Truvada, Emtriva, Tybost and Vitekta. Its products for patients with liver diseases include Vemlidy, Epclusa, Harvoni, Sovaldi, Viread and Hepsera. It offers Zydelig to patients with hematology/oncology diseases. Its products for patients with various cardiovascular diseases include Letairis, Ranexa and Lexiscan. Its products for various inflammation/respiratory diseases include Cayston and Tamiflu. It had operations in more than 30 countries, as of December 31, 2016. GILD has a current market cap of $106.6 billion.
Earnings and Sales Growth: Over the past year, earnings increased by 142%, while sales were 2% higher. In the last quarter, earnings slipped about -12.1% lower, while sales improved by about 5%. GILD’s operating profile is a sign of strength, since Net Income as a percentage of Revenues was 16.83% in the trailing twelve-month period and strengthened to 22.2% in the last quarter.
Free Cash Flow: GILD’s Free Cash Flow is healthy, at about $9 billion. On a Free Cash Flow Yield basis, that translates to 8.4%. It should be noted that this number has declined steadily since the beginning of 2016, when Free Cash Flow peaked at $19.5 billion, but has also improved from late 2019, when Free Cash Flow was about $6.6 billion. It does mark a drop from $9.4 billion in the quarter prior, and $10.8 billion a year ago.
Debt to Equity: GILD has a debt/equity ratio of 1.14, which is high, and also reflects increasing debt the company has taken on, in part to complete its acquisition of Immunomedics; but by itself this number doesn’t really tell the whole story. Their balance sheet shows $7.6 billion in cash in the last quarter (down from $23.9 billion at the end of 2020, but well above the $4.3 billion mark of a year ago) against roughly $24 billion in long-term debt. The company’s operating profile suggests there should be no problem servicing its debt. I think it is also worth noting that at the beginning of 2022, long-term was about $34.6 billion.
Dividend: GILD pays a dividend of $3 per share (up from $2.52 in 2019, $2.72 in 2020, $2.84 in 2021, and $2.92 before the most recent earnings announcement), which translates to an annual yield of about 3.51% at the stock’s current price. Management’s ability to increase the dividend is a positive sign.
Price/Book Ratio: there are a lot of ways to measure how much a stock should be worth; but I like to work with a combination of Price/Book and Price/Cash Flow analysis. Together, these measurements provide a long-term, fair value target around $61 per share, which means that GILD is overvalued by about -28.5%, with a useful bargain price at around $49.
Technical Profile
Here’s a look at the stock’s latest technical chart.
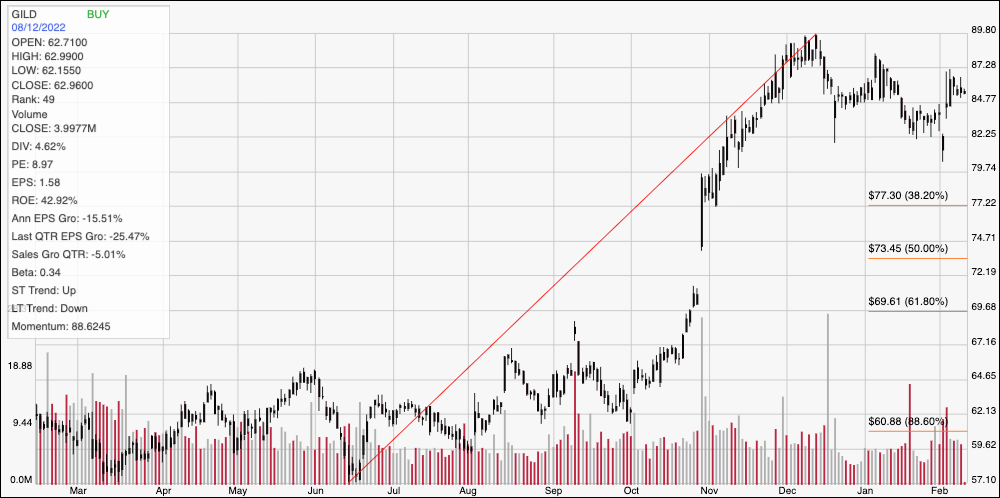
Current Price Action/Trends and Pivots: the chart above covers the last year of price activity for GILD. The diagonal red line traces the stock’s upward trend from its late June 2022 low at around $57 to its to its December peak at almost $90; it also provides the baseline for the Fibonacci retracement lines shown on the right side of the chart. The stock faded back to a low at around $82 to start February, but has rallied from that point to mark immediate resistance at around $86, with current support at around $84. A drop below $84 should find next support at about $82, while a push above $86 should see the stock retest its 52-week high at around $90.
Near-term Keys: Given the limited upside associated with GILD’s current valuation, the stock doesn’t work as a useful value right now. That means that the best probabilities in working with this stock lie in short-term trading strategies. You could use a break above $86 as an opportunity to buy the stock or work with call options, with $89 to $90 offering a practical profit target on a short-term, bullish trade. A drop below $84 could be a signal to consider shorting the stock or buying put options, with $82 offering a practical profit target level on a bearish trade.