Uncertain economic times means that, for the average investor, finding effective places to put your money to work for you become more difficult.
Interest rate fears stoked by inflation, plus the threat of war are just a couple of things that history has proven make up a pretty toxic mix for the stock market. Following the COVID-driven pressures of 2020 and 2021, along with Russia’s unprovoked war in Ukraine that started nearly a year ago created exactly the turbulence that drove market momentum in 2022. Even as the market has been looking for an optimistic foothold to start 2023, it’s an ignorant investor that doesn’t recognize that broad market risk remains high right now. I think that means that including defensively positioned stocks in your investing portfolio continues to be a smart thing to do.
One of the ways that a lot of people like to get defensive – to find useful “safe haven” assets – is to work with precious metals like gold and silver as way to diversity their portfolio. Working with the commodities themselves can be a good way to directly hedge against inflation risk. If you don’t want to work directly with the commodity itself, another alternative is to invest in the companies that mine, process, and produce it.
Barrick Gold Corp (GOLD) is one of the largest gold miners in the world, with operations in Canada, the United States, Central and South America, and Australia. The past year of market activity saw the stock peak in April at around $26, and then fall to into a downward trend that didn’t find bottom until November at around $13. That movement might defy the notion of using the stock as a way to get defensive when uncertainty is high, but another part of the value of a defensive-oriented strategy is to think about the company itself and the long-term opportunity it might offer.
Looking beyond the commodity and its value as a defensively-positioned, inflation-hedging asset, this is also a company with a very strong balance sheet. With geopolitical questions about Russia and its place in the global community continuing to keep tensions high, and with a Fed that remains hawkish when it comes to monetary policy, I think that means that gold – the asset, I mean – could continue to act as a good way to hedge inflation risk. What about GOLD, the company? Amid an environment of rising costs across practically every sector in the market, does this company still provide a good, defensively positioned proxy for the precious metal? If it does, it could be something worth considering as a smart way to diversify your portfolio.
Fundamental and Value Profile
Barrick Gold Corp is a gold mining company. The Company is principally engaged in the production and sale of gold and copper, as well as related activities, such as exploration and mine development. The Company’s segments, include Barrick Nevada, Golden Sunlight, Hemlo, Jabal Sayid, Kalgoorlie, Lagunas Norte, Lumwana, Porgera, Pueblo Viejo, Turquoise Ridge, Veladero and Zaldvar. Pueblo Viejo, Lagunas Norte, Veladero and Turquoise Ridge are its individual gold mines. The Company, through its subsidiary Acacia, owns gold mines and exploration properties in Africa. Its Porgera and Kalgoorlie are gold mines. Zaldivar and Lumwana are copper mines. The Pascua-Lama project is located on the border between Chile and Argentina. The Company owns a number of producing gold mines, which are located in Canada, the United States, Peru, Argentina, Australia and the Dominican Republic. GOLD has a current market cap of about $29.4 billion.
Earnings and Sales Growth: Over the last twelve months, earnings decreased by about -63%, while revenues also dropped by -16.2%. In the last quarter, earnings growth was flat, at exactly 0%, while revenues increased by 9.77%. The company’s margin profile, which has historically been healthy, is showing signs of significant deterioration; over the last twelve months, Net Income was 3.92% of Revenues, and declined to -26.5% in the last quarter. The drop to negative Net Income is a significant concern.
Free Cash Flow: GOLD’s free cash flow is $520 million over the last year. That marks a decline from $1.8 billion three quarters ago and about $1.3 billion in the previous quarter. The current number translates to a minimal Free Cash Flow Yield of 1.77%.
Debt/Equity: The company’s Debt/Equity ratio is .15, reflecting a conservative approach to leverage. Their balance sheet, in fact is a point of strength, since cash and liquid assets have improved from $3.3 billion in December 2019 to a little over $4.4 billion in the last quarter. It should be noted, however that a year cash was nearly $5.9 billion. Long-term debt currently stands at $48 billion, versus more than $12.5 billion in January of 2015, $5.4 billion in the last quarter of 2020, and $5.1 billion a year ago.
Dividend: GOLD’s annual divided is $.40 per share and translates to a yield of about 2.39% at the stock’s current price. The dividend has increased steadily since 2019; at the beginning of that year, the dividend was $.16 per share, $.28 per share at the beginning of 2020, and $.36 per share in mid-2021. The steady increase is a good sign that the company is focused not only on managing their business but also about finding constructive ways to return value to its shareholders.
Price/Book Ratio: there are a lot of ways to measure how much a stock should be worth; but I like to work with a combination of Price/Book and Price/Cash Flow analysis. Together, these measurements provide a long-term, fair value target around $5 per share. That means the stock is significantly overvalued right now, with -71% downside from its current price.
Technical Profile
Here’s a look at the stock’s latest technical chart.
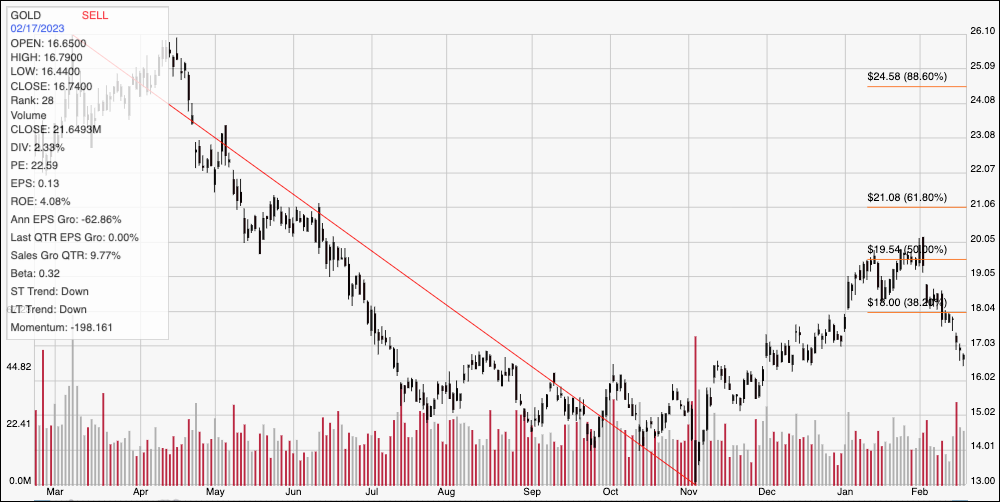
Current Price Action/Trends and Pivots: The chart above shows the last twelve months of price activity for GOLD. The red diagonal line traces the stock’s downward trend from its February 2022 high at around $26 to its low in November of last year at around $13; it also provides the baseline for the Fibonacci retracement lines on the right side of the chart. From that low, the stock rallied to a new, upward trend peak at around $20 to start this month, but has picked up a lot of bearish momentum from that point. Current support is expected to be at around $16.50 based on pivot highs seen in mid-November and August of last year, with immediate resistance at around $17. A push above $17 will have limited upside with $18 expected as next resistance based on the 38.2% retracement line. A drop below $16.50 could see downside to about $15 before finding next support based on pivot activity seen throughout September and October of last year.
Near-term Keys: GOLD’s overall fundamental strength has taken a pretty big hit in the last quarter – enough to shift the stock’s value proposition from interesting to alarming. If you prefer to work with short-term trades, a drop below $16.50 could offer an opportunity to short the stock or to work with put options, with an eye on $15 as a practical, very short-term profit target. With bearish momentum accelerating, and next resistance very close to the stock’s current price, it’s hard to see justification for a bullish, swing or momentum-based trade, since these strategies have a much lower than normal probability of success.