Sometimes, answering the question of whether a stock represents a legitimate, attractive value opportunity is more art than science.
Strict, quantitative value and fundamental analysis would dictate that you stick to the numbers, and to distrust anything but what the numbers tell you. As often as not, however, I find it necessary to look beyond the numbers my favorite fundamental metrics give me, because the truth is that business isn’t always just about the numbers. A company could be struggling to grow its business, and as a result be forced to restructure its business in a way that makes most of the traditional measurables investors like to use look very unfavorable. Sometimes, much broader concerns, upon which a company can exercise absolutely zero control, carry an impact on a company’s ability to grow. The last few years have proven the truth in that idea, as the coronavirus pandemic forced companies in every sector of the market to find new ways to survive, let alone to thrive.
It isn’t that the numbers – sales, earnings, free cash flow, debt, and so on – aren’t important, because of course they always are. They help to frame a company’s business over any given period of time in a useful context. Sometimes, however, you also need to be able to look beyond what that potentially limited context may describe. It can be important to remember that the numbers that make up fundamental and value-based metrics are almost always historical in nature; even forward-looking measurements and estimates are generally forced to rely to some extent on past performance to provide a framework for what a company might be able to do in the future. This is really where one of the challenges of stock market and value-based analysis is the greatest, as finding useful opportunities to put your money to work for you becomes even more subjective.
To add even more complication to the mix, broader economic conditions naturally play a role in this analysis. Some segments of the economy are more sensitive to the ebb and flow of economic growth, and so a smart investor tries to understand where the stock you may be considering fits into the overall economic picture. If you’re paying attention to stocks in the Energy sector, for example, you need to understand that in the broadest sense, these stocks are tied directly to crude oil, natural gas, and other energy-related commodity prices. Stocks in the Consumer Staples sector, on the other hand, like Food Products tend to be a bit less sensitive to economic fluctuations simply because even when the economy may be contracting, consumers still have to stock their pantries and fridges.
With the idea of economic cyclicality in mind, let’s think about the Consumer Discretionary sector. This is a sector that tends to be more sensitive to broad economic conditions, and if you drill down into some of the industries in the sector, that fact starts to make sense. The Specialty Retail industry takes in a pretty wide swath of company types that includes the kinds of focused, specialized retail stores you’ll commonly find at the mall. Even more to the point, when you start thinking about specialists like jewelers, I think the picture becomes even more clear. When factors like unemployment are high, and incomes are dropping, shopping for diamond jewelry becomes a lot harder for the average consumer.
2022 marked a change from the very accommodative monetary policy the Fed used to start this decade to support the economy during the worst of the pandemic. As consumer activity has increased, consumer prices have risen faster than many expected, marking inflationary levels last year that hadn’t been seen in the last 40 years and prompting the Fed to take an increasingly aggressive approach to raising interest rates. Most of those inflationary factors remain in place today, keeping rates high and prompting an increasing number of experts to predict an extended recession is becoming more and more inevitable.
For specialty retailers like Signet Jewelers Ltd (SIG), a prolonged, high interest rate environment, along with the looming spectre of economic recession means that these stocks may be exposed to a higher level of broad market risk than stocks in other industries. Despite that risk, this is a stock enjoyed a strong upward trend from June of last year to a peak in February. This is a company with a fortress-level balance sheet that features very low, manageable debt, healthy liquidity as well as Free Cash Flow and improving profitability. From that February peak at around $84, the stock has dropped back to its current price a little above $70. The real question now is whether the stock’s balance sheet make the stock a good bargain you should consider taking advantage of under current market conditions? Let’s try to find out.
Fundamental and Value Profile
Signet Jewelers Limited is a Bermuda-based retailer of diamond jewelry. The Company operates approximately 2,800 stores primarily under the name brands of Kay Jewelers, Zales, Jared, H.Samuel, Ernest Jones, Peoples Jewellers, Banter by Piercing Pagoda, JamesAllen.com, Diamonds Direct and Rocksbox. It offer clients an unmatched range of products in rounds, pears, marquise, princess, emerald, cushion and heart shaped diamonds.SIG’s current market cap is about $3.2 billion.
Earnings and Sales Growth: Over the last twelve months, earnings increased by about 10.2%, while sales moved -5.16% lower. In the last quarter, earnings increased by about nearly 646% (not a typo), while sales were 68.5% higher. The company’s historically narrow operating profile has strengthened in the last quarter. Over the last twelve months, Net Income was 4.8% of Revenues, and improved in the last quarter to 10.4%.
Free Cash Flow: SIG’s free cash flow is healthy, at $659 million for the trailing twelve month period; that translates to a Free Cash Flow yield of 19.88%. More interestingly, it does mark an increase from $444.5 million in the last quarter, but is below the $821.6 million mark of a year ago.
Debt to Equity: SIG has a debt/equity ratio of .09, which indicates the company applies a conservative philosophy about leverage and speaks in part to the company’s fortress-level balance sheet. For perspective, consider that in late 2018, SIG held only about $134 million in cash and liquid assets versus $671.1 million in long-term debt. As of the last quarter, cash and liquid assets were a little over $1.16 billion while long-term debt was just $147.4 million – down from $1.03 billion to begin 2021. It appears clear that management borrowed heavily at the beginning of 2020 to bolster its balance sheet against the broader declines it anticipated in the wake of the pandemic, as long-term debt jumped from a little over $500 million at the beginning of 2020 to a peak two quarters later at $1.33 billion.
Dividend: SIG suspended its dividend in early 2020 to preserve cash, but reinstated it in mid-2021 at a rate of $.72 per share, and increased it to $.80 per share, per annum in 2022, and $.92 after its most recent earnings report. That is modest, translating to an annualized yield of 1.26%, but the reinstatement, followed by increase is still a declaration of management’s confidence in the future.
Price/Book Ratio: there are a lot of ways to measure how much a stock should be worth; but I like to worth with a combination of Price/Book and Price/Cash Flow analysis. Together, these measurements provide a long-term target at about $54.50 per share. That suggests that the stock is quite overvalued right now, with with -23% downside from its current price, and a practical discount at around $44.
Technical Profile
Here’s a look at the stock’s latest technical chart.
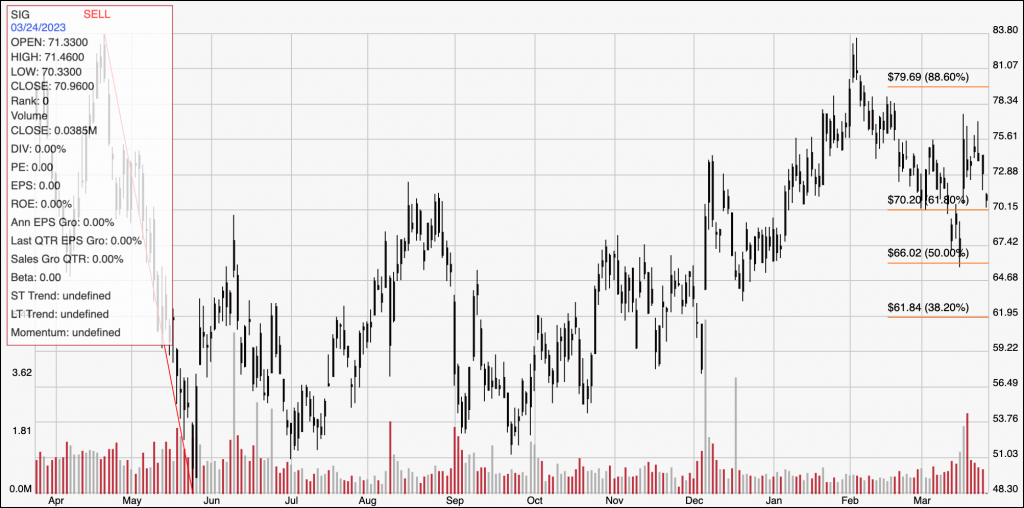
Current Price Action/Trends and Pivots: The chart above traces the stock’s price activity over the last year. The red diagonal line traces the stock’s downward trend from its high at $84 last April to its low in May at around $48. It also provides the baseline for the Fibonacci retracement lines on the right side of the chart. After trending upward from June of last year to a February peak at around $84, the stock dropped back to a low at around $66 in the middle of this month. It then rallied to mark immediate resistance at around $75 this week, and is current nearing expected, current support at around $70 where the 61.8% retracement line sits. A push above $75 should have upside to about $78, with $84 possible if buying activity increases. A drop below $70 should find next support at the last major pivot low, at around $66.
Near-term Keys: The stock’s latest upward trend failed to hold up, and the stock appears to be trying to determine the direction of its next trend. That could set up some interesting signals if you like to work with short-term trading strategies. A bounce off of current support at around $70 could act as a signal to think about buying the stock or working with call options, with $75 offering an attractive, near-term bullish profit target and additional room to around $78 if bullish sentiment increases. A drop below $70, on the other hand would be a good signal to consider shorting the stock or buying put options, with an eye on the last pivot low at around $66 providing an attractive profit target on a bearish trade. While the stock’s fundamentals, including a strong balance sheet to provide fundamental strength, there clearly isn’t a useful value proposition in place to consider the stock as a useful bargain buying opportunity.