Uncertain market conditions complicate all types of investing methods and styles.
That shouldn’t sound like a very surprising statement to make, since most successful systems rely, at least to some extent on clearly identifiable price patterns to help guide an investor’s decisions. Up, down, or even sideways – most systems can be adapted to work within one of those three kinds of conditions. Market uncertainty, however, breeds volatility, and volatility can force price action to be much more fluid and variable, over shorter periods of time, than many systems are built to handle.
Value investors, for example, tend to gravitate towards stocks that are at or near historical lows, because that increases the chances that the stock could be available at a nice bargain price. That assumption, however does rely on a clear identification of a long-term downward trend to start that analytical process. Sometimes, even an overall, long-term downward trend can be subject to a high degree of variability within the shorter blocks of time that combine to create it.
Today’s stock highlight is a good example. Caleres Inc. (CAL) is a small-cap retail footwear company that is generally best known for the Famous Footwear segment. Operating the Speciality Retail industry means this is a company that is highly dependent on foot traffic in local stores and malls (though it does also use e-commerce, which is increasingly important in today’s retail environment. Rising interest rates and supply chain complications throughout the past year or so, along with generally poor performance of most stocks in the Consumer Discretionary space all contributed the the stock’s long-term downward trend that began in July of last year at a peak around $31 per share, to its current price at around $21.50. That sounds like a clear downward pattern; but it doesn’t really describe the price movements this stock has seen in the intervening periods along the way.
From its high, the stock dropped to about $25 in late August of last year and consolidated around that price through all of September and the start of October. A temporary rally to about $27.50 was followed by a rapid drop from late November to mid-December at around $19 per share, after which the stock pushed quickly back up to a peak at around $26.50. It mostly hovered in that range through February, and then began its latest, rapid decline after the company’s latest earning report in early March, dropping to its latest support level at around $20.50 a couple of weeks ago, where it appears to be consolidating yet again. That’s a lot of variability within a nine-month period of time, and it suggests that even a disciplined trend follower has to be ready for the possibility this stock could break some of their investing system’s typical rules. What does all of that mean for value? Are the company’s fundamentals strong enough to suggest this stock could also offer an interesting value proposition at its current price? Let’s dig in to the details.
Fundamental and Value Profile
Caleres, Inc. is a global footwear company. The Company’s activities include the operation of retail shoe stores and e-commerce websites, as well as the design, development, sourcing, manufacturing, marketing and wholesale distribution of footwear. Its segments include Famous Footwear and Brand Portfolio. The Famous Footwear segment is comprised of Famous Footwear, famousfootwear.com and famousfootwear.ca. It operates approximately 965 stores, including the Famous Footwear and Brand Portfolio. The Brand Portfolio segment is comprised of wholesale operations selling its branded footwear, and the retail stores and e-commerce sites associated with those brands. The Brand Portfolio segment sources, manufactures and markets licensed, branded and private-label footwear primarily to online retailers, national chains, department stores, mass merchandisers and independent retailers, as well as Company-owned Famous Footwear, Sam Edelman, Naturalizer and Allen Edmonds stores and e-commerce businesses. CAL has a current market cap of about $764 million.
Earnings and Sales Growth: Over the last twelve months, earnings shrank by about -28.6%, while revenues increased by about 2.53%. In the last quarter, earnings declined by nearly -43.5%, while sales declined by about -12.75%. The company’s margin profile is modest healthy, at more than 6.12% over the last year, but narrowed somewhat to 5.86% in the last quarter.
Free Cash Flow: CAL’s free cash flow is very strengthening after deteriorating for most of the past year, at about $61.84 million in the last quarter. That marks a useful increase from -$30.01 million in the previous quarter, and translates to a Free Cash Flow Yield of 8.09%.
Debt to Equity: CAL’s debt to equity is 0, meaning that CAL has no current long-term debt. This is also a condition that has been true of this company for all of the past year. Their balance sheet shows $33.7 million in cash and liquid assets.
Dividend: CAL pays an annual dividend of $.28 per share, which works out to an annualized yield of 1.31% at the stock’s current price.
Price/Book Ratio: there are a lot of ways to measure how much a stock should be worth; but I like to worth with a combination of Price/Book and Price/Cash Flow analysis. Together, these measurements provide a long-term target at around $19.50 per share. That suggests CAL is overvalued, with about -8.7% downside from its current price, and a useful discount price at around $15.50.
Technical Profile
Here’s a look at the stock’s latest technical chart.
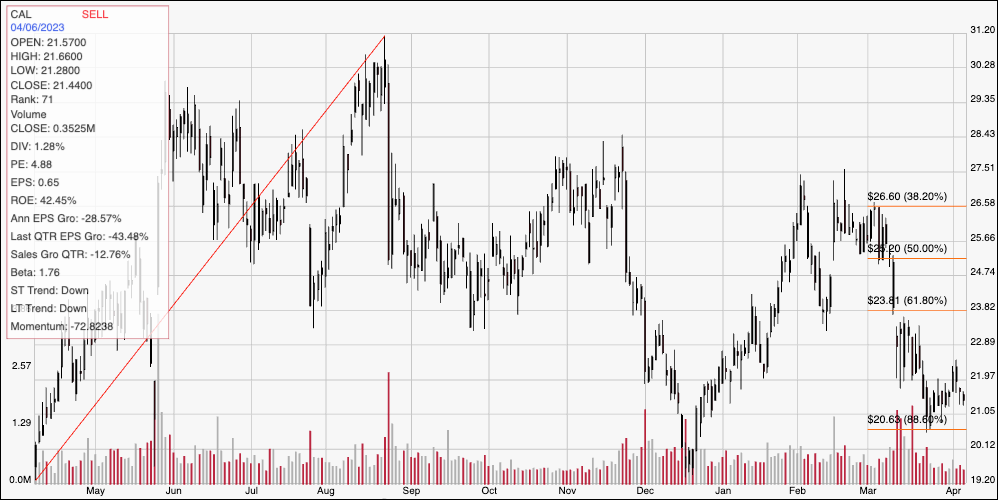
Current Price Action/Trends and Pivots: The diagonal red line traces the stock’s upward trend from its low at year ago at around $19 to its August high at about $31. It also provides the reference for the Fibonacci retracement lines on the right side of the chart. The stock’s overall, downward pattern from that August high is clear, but so is the wide range of price action from one pivot point to the next. Most recently, the stock has found current support at around $20.50, and is consolidating a little above that level, with immediate resistance at around around $22 per share. A drop below $20.50 should retest the stock’s 52-week low at around $19, while a push above $22 should have upside to about $24, around multiple pivot low points seen in February as well as September and July of last year.
Near-term Keys: The stock’s current consolidation range within the longer downward trend could be a tempting pattern for contrarian investors. Unfortunately, however the stock’s value proposition doesn’t support CAL as a useful long-term opportunity. There are some interesting fundamentals strengths in place, however before I would reconsider my evaluation of this stock, the current reversal of negative Free Cash Flow would need to show sustained improvement. That means that the best probabilities lie in short-term trading strategies. If the stock pushes above $22, you could consider buying the stock or working with call options, using $24 as a speculative, but practical profit target given the current, clear downward trend. A drop below $20.50, on the other hand could be a good signal to think about shorting the stock or buying put options, using $19 as a quick-hit profit target on a bearish trade.