In many way, 2023 has been an extension of fears and uncertainty that plagued the market for most of 2022.
The last year and a half has shifted the narrative away from COVID and onto the reality of inflation, rising interest rates, and all of its normal effects. Issues that existed prior to the pandemic, like labor shortages, supply chain problems and the war in Ukraine have all compounded to keep inflation indicators high, in turn keeping the Fed mostly hawkish about monetary policy throughout the period. The fact that after its latest increase in May, the Fed statement signaled that it may consider pausing rate increases in the near future. That’s led economists and the market to speculate that the era of rising interest rates may be over.
The economic questions I’ve just described have put Specialty Retail industry in a dangerous spot, which is why it isn’t too surprising that a lot of well-known names in the industry are significantly below their 2021 highs, and have moved into sizable, extended downward trends. That includes Best Buy Co (BBY). BBY resides in an already, intensely competitive landscape, but that has become more and more fierce under the weight of pressure from inroads made by Amazon (AMZN) in its digital and technology-centric offerings while still facing intense competition from big-box retailers like Walmart (WMT) and Target (TGT). That is a symptom of what has become a clear, long-term, “sea change” kind of shift by consumers away from traditional brick and mortar stores to online shopping alternatives.
BBY has been working hard to stay relevant amidst that change, and many of those changes are what has enabled the company to succeed over the last three years. This is a company with some interesting fundamental strengths including a very solid balance sheet and free cash flow, manageable debt and an attractive dividend. The stock dropped more than -50% from its November 2021 peak to an October 2022 low at around $61, and then rallied to a high to start February of this year at around $90 per share. Since then, the stock has dropped back into a clear intermediate-term downward trend that may have found a bottom in May at around $69 – about -23% below that February high. Does that mean that the stock’s current price an opportunity to get in at a good value price for long-term investors, or would it smarter to wait? Let’s find out.
Fundamental and Value Profile
Best Buy Co., Inc. is engaged in personalizing and humanizing technology solutions. The Company operates through two segments: Domestic and International. Domestic segment is comprised of its operations in all states, districts and territories of the United States and its Best Buy Health business, and includes the brand names Best Buy, Best Buy Ads, Best Buy Business, Best Buy Health, CST, Current Health, Geek Squad, Lively, Magnolia, Pacific Kitchen and Home, TechLiquidators and Yardbird and the domain names bestbuy.com, currenthealth.com, lively.com, techliquidators.com and yardbird.com. International segment is comprised of all operations in Canada under the brand names Best Buy, Best Buy Mobile and Geek Squad and the domain name bestbuy.ca. Domestic and International segments product categories include Computing and Mobile Phones, Consumer Electronics, Appliances, Entertainment, Services and Other. Computing and Mobile Phones category includes computing, mobile phones, and others. BBY’s market cap is $15.8 billion.
Earnings and Sales Growth: Over the last twelve months, earnings declined by -26.75%, while revenues also dropped a little over -11%. In the last quarter, earnings were almost -56% lower while sales declined by about -36%. BBY operates with a very narrow, but generally stable margin profile. Over the last twelve months, Net Income was about 2.93% of Revenues, and narrowed slightly last quarter to 2.58%. I read decline and earnings and sales, along with the taper in operating margins, as clear indications of declining consumer demand for big-ticket items like PC’s, home appliances, and SMART televisions.
Free Cash Flow: BBY’s Free Cash Flow over the last twelve months was about $1.96 million. That translates to a healthy Free Cash Flow Yield of 12.32%, and marks a sizable increase from $894 billion in the last quarter, and $824 billion a little over a year ago. Growth in Free Cash Flow could be cyclical – this number was about $1.2 billion two quarters prior – but the size of the increase is also an interesting counterpoint to the declining earnings and Net Income pattern I just described.
Debt to Equity: the company’s debt to equity ratio is .41, a very low number that reflects the company’s biggest strength, which can be seen in its balance sheet. In the last quarter, management reported $1.03 billion in cash and liquid assets against about $1.15 billion in long-term debt. Cash has increased over the past year, from $840 million a year ago, but did drop from about $1.9 billion in the quarter prior.
Dividend: BBY pays an annual dividend of $3.68 per share, which translates to an annual yield of about 5.06% at the stock’s current price. It’s worth noting that BBY has increased their dividend from $2.00 at the end of 2019, $2.10 in 2020, $2.80 in 2021, and $3.52 at the beginning of this year. The ability to raise its dividend is a notable sign of strength.
Price/Book Ratio: there are a lot of ways to measure how much a stock should be worth; but I like to work with a combination of Price/Book and Price/Cash Flow analysis. Together, these measurements provide a long-term, fair value target around $59 per share. That suggests that BBY is overvalued, with -17% downside from their current price, and a useful discount price at around $47.
Technical Profile
Here’s a look at the stock’s latest technical chart.
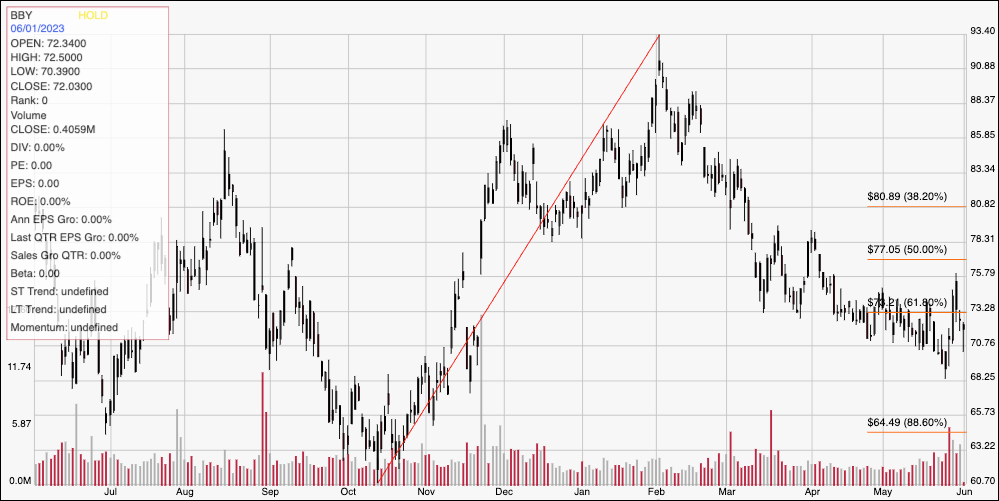
Current Price Action: This chart represents BBY’s price activity over the past year. The red diagonal line traces the stock’s upward trend from its $61 low in October of last year to its high to start February at around $93.50 It also provides the baseline for the Fibonacci retracement lines shown on the right side of the chart. The stock has dropped sharply from that peak into a clear downward trend, with its most recent major pivot low coming a little over a week ago at around $69 per share to mark current support at that level. Immediate resistance should lie a little above $73, where the 61.8% retracement line sits. A push above $73 should find next resistance between $76 and $77, where the 50% retracement line waits, while a drop below $69 could see additional downside to about $66, based on pivot activity seen in October of last year.
Near-term Keys: If you’re looking for a value-based, long-term investment, BBY has some useful fundamental strengths, but lacks the value proposition to make me want to take it seriously as a good bargain opportunity right now. The stock would need to drop to around $47 before a stronger value-based argument can be made. If you’re looking for a short-term opportunity, however, there are a couple of signal points that could be useful. A push above resistance at $73 could act as a good signal to consider buying the stock or working with call options, with a short-term, momentum-based target price at around $76 per share. If the stock drops below current support at $69, you could also think about shorting the stock or buying put options, with an eye on $66 as a useful profit target on a bearish trade.