The longer a bull market lasts, the more extended price valuations become. The longer that condition continues, the harder it becomes for value-oriented investors to justify long-term investments in most of the stocks, industries and sectors that everybody else is talking about. I think this picture is starting to fit current market conditions, as valuations on stocks in a number of industries have once again reached levels that become harder and harder to justify.
The irony of current market conditions is that all of the major indices have managed to press to fresh, new all-time highs against the backdrop of a global pandemic and all of the societal and economic difficulties associated with it. I’m not a gloom-and-doom kind of person; in fact, I am amazed to see the way that a lot of businesses have managed to adapt to a new reality and not only survive, but succeed in impressive ways. Those successes, however, seem to have given the broad market reason to brush aside harsher realities that the entire world is still faced with. In the U.S., unemployment remains high and small businesses continue to struggle to survive the extended effect that self-isolation, social distancing, and restricted operations have forced on everybody all year long. Whether or not the federal government’s two stimulus packages will be sufficient to help alleviate those difficulties remains to be seen.
The contrast between prosperity and scarcity doesn’t end there, either; home prices and real estate values are higher than they were a year ago in many places across America, even as risk increases of defaults on both commercial and residential rental properties. Some reports seem to clearly indicate that affordability is worse than ever, as prices have increased far more than average income, making it harder for many people looking to buy a home to be able to afford it. That becomes even more interesting, and troubling when you consider against the backdrop of already mentioned, continued high unemployment numbers. It begs the question of how much longer the contradictions can remain in place before something has to give.
One of the industries that you would expect to suffer during an economic downturn is Heavy Machinery. This is an industry in a sector, Industrials, that most analysts consider to be pretty cyclical; yet many of the largest companies in the sector – Caterpillar Inc. (CAT) and Deere & Co. (DE), for example – have followed the movement of the major indices to new, multiyear highs that would tempt you to believe that business is better than ever. That perception even extends to smaller competitors, like Terex Corp (TEX); this is a stock that has rebounded by almost 200% from its pandemic-prompted, bear market bottom at around $12 in the first quarter of 2020.
I think some of that action in these smaller companies comes from measures management may have to take to preserve capital and retain financial flexibility that larger companies may not have to take. In the case of TEX, slowdowns associated with the coronavirus pandemic prompted management to announce a suspension of its dividend, along with employee furloughs and reduced salaries for executives and cuts in production. The company’s earnings and Net Income through the last couple of quarters both reflect a significant impact from nationwide shutdowns and shelter-in-place orders; at the same time, their balance sheet remains strong enough given their size to give them the financial stability and flexibility they need to ride through the current crisis, however long it lasts. What does that backdrop mean for the stock, which investors have been pushing to highs not seen since 2018? Let’s dive in and find out.
Fundamental and Value Profile
Terex Corporation is a manufacturer of lifting and material processing products and services that deliver lifecycle solutions. The Company has three business segments: Aerial Work Platforms (AWP), Cranes and Materials Processing (MP). It delivers lifecycle solutions to a range of industries, including the construction, infrastructure, manufacturing, shipping, utility, quarrying and mining industries. The AWP segment designs, manufactures, services and markets aerial work platform equipment, telehandlers and light towers. The AWP segment’s products are used by its customers to construct and maintain industrial, commercial and residential buildings and facilities, and for other commercial operations, as well as in a range of infrastructure projects. The Cranes segment’s products are used by its customers for construction and manufacturing facilities, among others. The MP segment’s products are used by its customers in construction, infrastructure and recycling projects. TEX’s current market cap is $2.4 billion.
Earnings and Sales Growth: Over the last twelve months, earnings declined more than -62% while revenues declined about -25.25%. In the last quarter, earnings improved dramatically, by 720% (not a typo), while sales were almost 11% higher. TEX operates with a historically narrow margin profile that has been negative over the last twelve months, but appears to be strengthening. In the last twelve months, Net Income was -0.12% of Revenues, but improved to 0.76% in the last quarter. Narrow margins are not unusual in the Heavy Machinery industry, and given the nationwide shutdown of business operations from COVID-19, the negative Net Income pattern may not be surprising. Whether the shift to a positive number in the last quarter signifies a turn back to profitability is a question that can only be answered over time; for now, this is a pattern that bears watching.
Free Cash Flow: TEX’s free cash flow has been under pressure for the past year and is showing signs of weakening. Over the last twelve months, Free Cash Flow was $71.8 million – down from $231.6 million at the end of the first quarter of the year and $115.9 million in the quarter prior. The current number translates to a modest Free Cash Flow Yield of 2.97%.
Debt to Equity: TEX has a debt/equity ratio of 1.37. That number implies a high level of leverage, which of itself isn’t particularly alarming in the Heavy Machinery industry. Their balance sheet shows $508 million in cash and liquid assets against about $1.16 billion in long-term debt.
Dividend: TEX suspended its dividend earlier this year to preserve cash. It is unknown when or if the dividend might be reinstated; in the report management stated their dividend would be suspended for the remainder of 2020 but provided no additional details.
Price/Book Ratio: there are a lot of ways to measure how much a stock should be worth; but I like to work with a combination of Price/Book and Price/Cash Flow analysis. Together, these measurements provide a long-term, fair value target at about $27 per share. That means the stock is overvalued by about -22% at its current price, with a discount price sitting back at around $22 per share.
Technical Profile
Here’s a look at the stock’s latest technical chart.
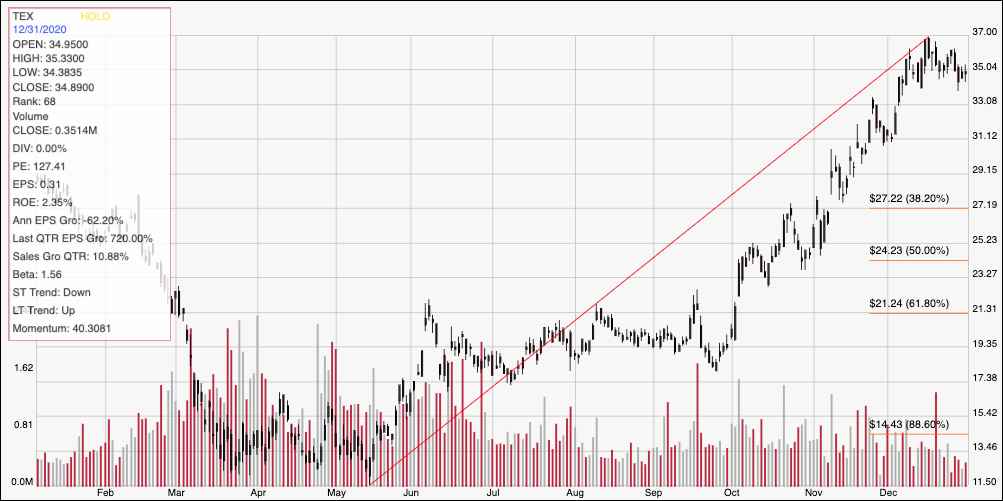
Current Price Action/Trends and Pivots: The red diagonal line measures the length of the stock’s upward trend from May of 2020 to its peak in December at around $37. It also provides the baseline for the Fibonacci retracement levels shown on the right side of the chart. The stock has faded a bit from that point, with immediate support expected at around $33. Resistance is at that recent peak, at $37. A bounce off of support at $33 should see a short-term swing to resistance at $37; if you use the $4 difference between those two prices to think about the distance between support and resistance, a break above $37 should have upside to about $41 before finding next resistance. A drop below $33 should find next support at around $31; but if bearish momentum accelerates, it could drop quickly to about $27 where the 38.2% retracement line rests.
Near-term Keys: The balance sheet for TEX has held up relatively well during 2020, considering the challenges the company has been dealing with; even so, declines in Free Cash Flow and deteriorating Net Income are also concerns that I think make this a stock to come back to in the quarters ahead rather than trying to use it as a useful long-term opportunity right now. That means the best probabilities lie with short-term trades. $33 is likely to be an important signal point for any kind of useful, momentum-based trade. Use a bounce off of support at $33 as an opportunity to think about buying the stock or working with call options, with a near-term target price at about $37; $41 might be applicable if bullish momentum starts to increase. A drop below $33 might be a good signal to consider shorting the stock or buying put options – but with next expected support at around $31, be ready to work with a very short-term trade, and don’t hesitate to take profits on a bearish trade quickly.