One of the challenges for every investor is the task of assimilating different storylines to put the market in practical context.
Beginning In 2022, the focus began to shift away from pandemic-driven questions to concerns about the pace of inflation and the rise in interest rates that some fear could push a growing economy into a full-fledged recession – concerns that continue to persist today. Those pressures have added uncertainty to just about every sector of the market, including the ones that became star performers in 2020 and 2021.
Through 2020 and 2021, one of the most bullish storylines focused on streaming services provided by companies like Netflix (NFLX), Disney (DIS), Amazon (AMZN), to name a few, who all saw big increases in their stock prices as subscriber growth rates surged. 2021 saw some of that price activity normalize, but remain very high. Over the last year or so, some of the luster has come off of these services; NFLX, for example reported two consecutive quarters of negative subscriber growth earlier this year, which have left analysts asking questions about the sustainability of the massive borrow and spending habits these companies have employed to populate their services with content to keep consumers engaged. DIS has a similar story about its Disney+ service – especially given that reported miscalculations were a primary factor in the removal of Bob Iger’s replacement, and his reappointment as CEO late last year.
One of the companies that I’ve followed for quite a while, and been using in my value-focused system is Paramount Global (PARA). This is a company formed from a merger between Viacom and CBS Corporation, creating a combined television and film studio designed to stand on its own in the Media industry of the Communication Services sector. This is an industry that has become dominated by streaming services, with major TV and film studios like Disney, Warner Bros., and ViacomCBS all looking for a foothold to compete with Netflix and Amazon, who generally hold the distinction of being industry disruptors that fueled the consumer switch to streaming media. Late in 2021, the company renamed itself from ViacomCBS to Paramount Global and adopted its current stock symbol. While Paramount has name-brand recognition, and carries weight in the TV and film industry, the name change was intended to reflect the company’s focus on shifting its business model to leverage its massive library of movies and shows, as well as its production capabilities and strengths in those legacy businesses in improving its own stake in the streaming media space.
One of the big numbers analysts in this space pay a lot of attention to is new subscriber rates. PARA owns Paramount+, its paid streaming service with access to movies, new and legacy TV titles, and live news and sports content, as well as Pluto TV, one of the world’s biggest free, ad-supported streaming platforms. Combined, these services give PARA an interesting foothold in the streaming media segment, with more than 135 million subscribers. The company plans to expand their availability into the UK and much of Western Europe through the rest of this year. They’ve prepared for that launch in part by forging agreements for live sports broadcasts of European sporting events such as Euroleague soccer (nee´ football). In the area of traditional media, the company benefitted in 2022 from early success as manifested by the massive success of Top Gun: Maverick encouraging viewers to return to theaters for a traditional cinematic experience. Where its competitors rely on studio licensing agreements for legacy content, or to spend massive amounts of borrowed money to fund new projects, PARA’s massive, existing libraries give it a unique ability – shared, perhaps, only with Disney – to generate low-cost, incremental consumption that makes its multiplatform offerings even more interesting.
The real question, of course is what all of that means for the stock. The stock diverged from most of its brethren in early 2021, plunging from a peak at around $100 to about $40 in a matter of just a few Reddit-fueled trading days. In late 2021, the stock dropped down to new lows at around $29 but appeared to be establishing a new consolidation base until late April of this year. Bearish momentum in the market, along with broad momentum against companies in the streaming media space pushed the stock to a new, multi-year low at around $15 in November of last year. That provided a springboard for the stock to rally to a February peak at around $24. The stock has been fading back off of that high since and appears to be picking up new, bearish momentum. Is the fundamental story for PARA really so bad that that stock should be cheaper, or is this just broader, industry-specific momentum having its way with a stock that is offering an incredible value? Let’s try to find out.
Fundamental and Value Profile
Paramount Global, formerly ViacomCBS Inc., is a global media and entertainment company that creates content for audiences worldwide. The Company’s business segments include TV Entertainment, Cable Networks, and Filmed Entertainment. The TV Entertainment segment operates the CBS Television Network, its domestic broadcast network; CBS Studios and CBS Media Ventures, its television production and syndication operations; CBS branded streaming services, including CBS All Access/Paramount+; CBS Sports Network, and its cable network focused on college athletics and other sports. The Cable Networks segment operates a portfolio of streaming services, including Pluto TV, a free advertising-supported streaming television (FAST) service and Showtime Networks’ subscription streaming service (SHOWTIME OTT). The Filmed Entertainment segment operates Paramount Pictures, Paramount Players, Paramount Animation and Paramount Television Studios, and also includes Miramax, a consolidated joint venture. PARA has a current market cap of about $13.2 billion.
Earnings and Sales Growth: Over the last twelve months, earnings declined by about -69.25%, while revenue rose by 1.64%. In the last quarter, earnings were nearly -79.5% lower, while revenues improved by almost 17.6%. Over the last twelve months, Net Income was 3.66% of Revenues, and declined to 0.26% in the last quarter. That pattern confirms a longer pattern of quarterly decline over the last year that is attributable, at least in part, to the company’s aggressive investments in expanding its digital footprint; it entered the streaming media space well behind its larger competitors and is still playing catch-up.
Free Cash Flow: PARA’s free cash flow has been declining for most of the past year as the company invests heavily in expanding its streaming presence, however the last quarter is showing some improvement. In the last quarter, Free Cash Flow was -$139 million, versus -$717 million a year ago and $724 million in the quarter prior. The negative number isn’t attractive, however the increase from the prior quarter is encouraging. I also think it is worth noting that management is forecasting those efforts to pay off this year, while skeptical analysts are pointing to 2024. I’ll split the difference and say that if you like this company, you may need to think about the possibility of playing a long-term waiting game until later this year to see these numbers turn positive.
Dividend: VIAC’s annual divided is $.96 per share, which translates to a yield of 4.6% at the stock’s current price.
Debt/Equity: PARA carries a Debt/Equity ratio of .66, which is a significant drop from 1.23 at the beginning of 2021, .84 about a year ago and .73 six months ago. Their balance sheet shows about $2.8 billion in cash and liquid assets versus about $15.6 billion in long-term debt. Their operating profile, along with their strong cash position suggests that, while Net Income is leaving no room for error, debt service isn’t a problem. An extension of the current Free Cash Flow and Net Income pattern could further erode liquidity, which means the quarters ahead certainly bear watching. Management has also indicated their intention to use their cash position to further reduce debt and increase shareholder returns (presumably in the form of stock buybacks and/or dividend increases).
Price/Book Ratio: there are a lot of ways to measure how much a stock should be worth; but I like to work with a combination of Price/Book and Price/Cash Flow analysis. For additional context, I’ve also incorporated estimated growth rates into my analysis. All together, these measurements provide a long-term, fair value target at around $31.50 per share. That suggests that the stock is undervalued, with about 55% upside from its current price. It is worth noting that a quarter ago, this same analysis yielded a fair value target price at around $64.50 per share.
Technical Profile
Here’s a look at the stock’s latest technical chart.
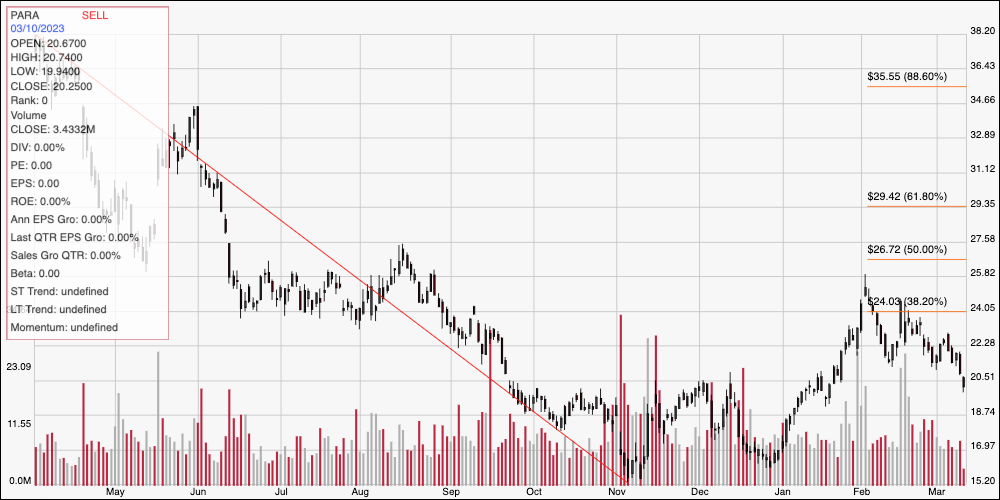
Current Price Action/Trends and Pivots: This chart looks at the last year of price activity for PARA. The red diagonal line measures the length of the stock’s downward trend from its high a year ago at around $38 to its yearly low, reached in November of last year at around $15. It also informs the Fibonacci trend retracement lines shown on the chart. After rallying to a little above the 38.2% retracement line at around $24 in February, the stock consolidated for the next month, with consolidation support at around $21.50. The stock dropped below that level yesterday and appears to be following that momentum lower, marking immediate resistance at $21.50 (previous support becomes new resistance), with next support at around $18.50. A push above $21.50 will find next resistance at about $24, while a drop below $18.50 would likely see the stock retest its yearly low at around $15 per share.
Near-term Keys: The deterioration of PARA’s core fundamental metrics – especially Free Cash Flow and Net Income – are a big concern, but as always, context is everything when you are working with a long-term investing strategy. I do think that the stock’s current, increasing bearish momentum, along with the weakening fundamental profile mean that thinking about a new, value-oriented investment is risky; I would wait to see if Net Income and Free Cash Flow can both reverse in sustained fashion before taking a new opportunity seriously. If you prefer to work with short-term trading strategies, you can also take a break above $21.50 as a signal to think about buying the stock or working with all options, with $24 offering a useful bullish profit target. A drop below $18.50 could be an interesting signal to consider shorting the stock or buying put options – but be quick to take profits at around $15 on a bearish trade.