Abercrombie & Fitch Co. (ANF) is a leading global retailer known for its stylish and casual clothing, targeting a youthful demographic. The company operates several well-known brands, including Abercrombie & Fitch, Hollister Co., and Abercrombie Kids, each catering to specific customer segments. Their product offerings range from casual wear like t-shirts and jeans to more fashion-forward pieces, appealing to a wide array of styles and preferences. Abercrombie & Fitch has built a strong brand identity characterized by a laid-back, California-inspired aesthetic, often emphasizing a sense of adventure and exploration in its marketing.

The company’s growth is driven by several key factors. First, Abercrombie & Fitch has successfully focused on enhancing its digital presence, investing in e-commerce and online marketing strategies to reach a broader audience. This has become increasingly important as consumer shopping habits shift towards online platforms. Additionally, the company is committed to improving the in-store experience by redesigning their retail locations and offering a more personalized shopping experience. The brand’s efforts to embrace inclusivity and diversity in their marketing and product offerings also resonate well with younger consumers, contributing to their ongoing relevance in a competitive retail landscape.
Furthermore, Abercrombie & Fitch actively engages in sustainable practices, which appeal to environmentally conscious shoppers. By focusing on sustainability, the company enhances its brand image while meeting the growing demand for ethical fashion. Overall, Abercrombie & Fitch Co. continues to evolve by adapting to changing market trends and consumer preferences, positioning itself for continued growth in the dynamic retail industry.
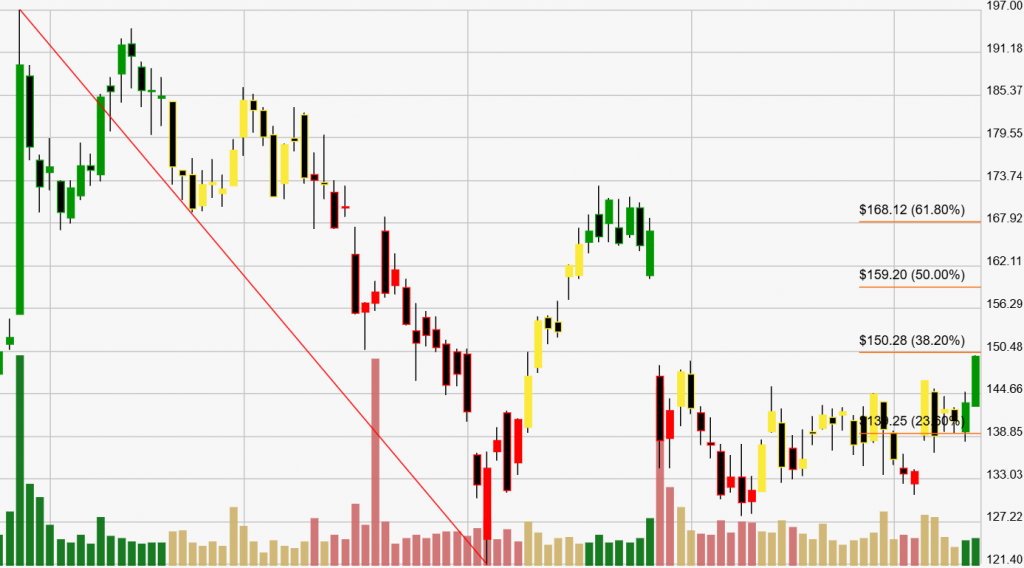
Click The Image For Current Live ChartBacktesting a stock can provide investors with critical statistical data. These results give you an informed perspective on how a stock trades within your chosen buying and selling method of analysis. The definition of trade expectancy is defined as: trade expectancy = (probability of win * average win) – (probability of loss * average loss). If the calculation returns a positive number, a trader should make money over time.
The average percentage gained on positive, money making trades was 44.69%. While the average percent loss on money losing trades was 18.05%.
Trade expectancy includes both winners and losers. Trade expectancy is displayed as a percentage. This backtest displays the dollar value, percentage, annual trade expectancy, and annual percent. Annual expectancy is the trade expectancy percentage multiplied by the number of trades per year.
The Trade expectancy % for ANF over the past year is 29%. The number of trades generated per year was 4 giving an Annual Trade Expectancy of 116%
The average days in a trade is 83 and the average days between trades is 34.
With any method of analysis that uses past performance, it can be said that past performance is not indication of future performance. What is does provide is a probabilistic look at a stock’s price activity characteristics over time.
