US Foods Holding Corp. (USFD) is one of the largest foodservice distributors in the United States, specializing in providing a wide range of food and related products to restaurants, healthcare facilities, and other foodservice operators. Founded in 1989 and headquartered in Rosemont, Illinois, US Foods operates a national network of distribution centers, enabling it to deliver fresh and frozen products, dry goods, and kitchen supplies efficiently.

The company’s diverse product offerings include everything from meats, seafood, and dairy to dry goods, beverages, and disposables. US Foods is known for its commitment to quality and customer service, offering innovative solutions to help its customers enhance their operations and meet evolving consumer preferences. The company also provides resources such as culinary support, menu development, and business insights to help foodservice operators succeed in a competitive market.
The main drivers of growth for US Foods include the increasing demand for foodservice products as the restaurant and hospitality sectors recover from the impacts of the COVID-19 pandemic. As consumer preferences shift towards dining out and food delivery, US Foods is well-positioned to capitalize on these trends with its extensive product range and distribution capabilities. Additionally, the company’s focus on technology and data analytics enhances its ability to streamline operations and improve customer service. US Foods is also committed to sustainability, implementing practices that reduce waste and improve efficiency throughout its supply chain. Learn more at US Foods Holding Corp..
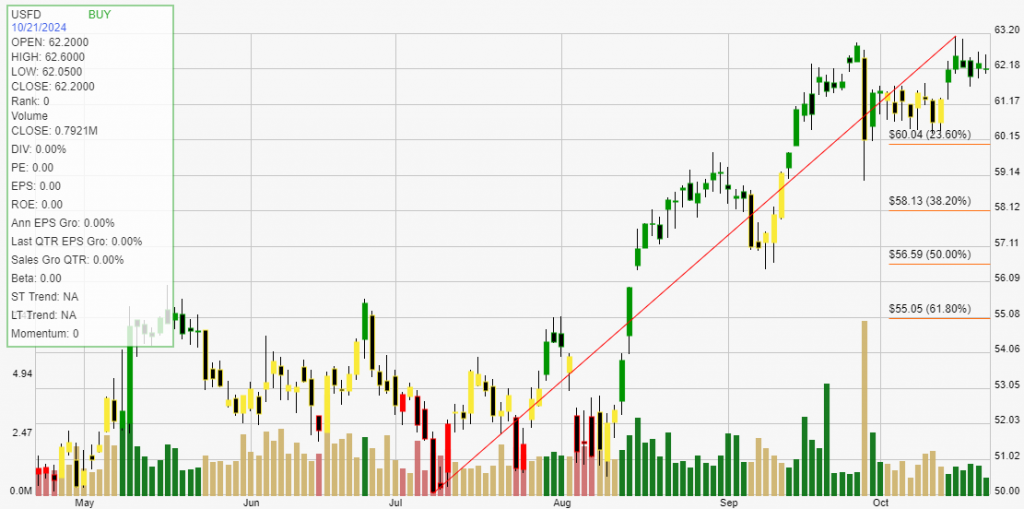
Click The Image For Current Live Chart
Backtesting a stock can provide investors with critical statistical data. These results give you an informed perspective on how a stock trades within your chosen buying and selling method of analysis. The definition of trade expectancy is defined as: trade expectancy = (probability of win * average win) – (probability of loss * average loss). If the calculation returns a positive number, a trader should make money over time.
The average percentage gained on positive, money making trades was 18.51%. While the average percent loss on money losing trades was 3.50%.
Trade expectancy includes both winners and losers. Trade expectancy is displayed as a percentage. This backtest displays the dollar value, percentage, annual trade expectancy, and annual percent. Annual expectancy is the trade expectancy percentage multiplied by the number of trades per year.
The Trade expectancy % for USFD over the past year is 5.3%. The number of trades generated per year was 4 giving an Annual Trade Expectancy of 21.21%
The average days in a trade is 52 and the average days between trades is 24.
With any method of analysis that uses past performance, it can be said that past performance is not indication of future performance. What is does provide is a probabilistic look at a stock’s price activity characteristics over time.