Oil prices were among some of the most dramatically impacted components of the global economy at the early stages of the coronavirus pandemic. As businesses were shuttered, and shelter-in-place orders ground economic activity everywhere to a halt, demand for crude oil cratered; both West Texas Intermediate (WTI) and Brent crude fell to shockingly low levels. That pressure came on the heels of a price war between Saudi Arabia and Russia that had already started putting pressure on oil at the beginning of the year. While the stock market found a bear market bottom in mid-March, oil continued to struggle and didn’t find a practical low until the beginning of May. Since then, gradual economic reopening and the lifting of some social restrictions has renewed some of the demand for oil, with both WTI and Brent crude futures appearing to stabilize in the last couple of weeks around the $40 per barrel range.
The rally from their lows – WTI crude bottomed at less than $10 per barrel, while Brent’s bottom was a little below $20 – has been impressive in the last couple of months, and is probably enough that, for the more conservatively managed companies in the sector, should help to lift balance sheets out of what many analysts thought might be an unsalvageable situation. It’s true that many of the largest, most recognizable names in the industry have absorbed big blows in the form of Net Income turns to negative territory and declining profitability as reflected by measurements like earnings and free cash flow. And if oil had consolidated in those low extremes, the fact is that the outlook for most of the industry would be far worse than it is today. Even so, oil prices for both commodities remain more than -50% below their levels at the end of 2019, with plenty of uncertainty ahead.
Schlumberger N.V. (SLB) is one of the largest companies in the world in the Energy Equipment & Services industry. It’s movement over the course of 2020 has pretty much mirrored that of the rest of the energy sector, dropping from around $42.50 before the pandemic to a March low around $12 before rallying to a peak in June at around $22.50 per share. Since then the stock has dropped back again and appears to be consolidating around $18 per share. There are aspects of SLB’s fundamental profile that are better than you might expect them to be, and the stock is currently offering a value proposition that is tempting; but until some tangible improvements are seen in the company’s operating profile, it might be better to keep this stock on a wait-and-see watchlist before making a bet on its long-term prospects. Let’s take a look.
Fundamental and Value Profile
Schlumberger N.V. provides technology for reservoir characterization, drilling, production and processing to the oil and gas industry. The Company’s segments include Reservoir Characterization Group, Drilling Group, Production Group and Cameron Group. The Reservoir Characterization Group consists of the principal technologies involved in finding and defining hydrocarbon resources. The Drilling Group consists of the principal technologies involved in the drilling and positioning of oil and gas wells. The Production Group consists of the principal technologies involved in the lifetime production of oil and gas reservoirs and includes Well Services, Completions, Artificial Lift, Integrated Production Services (IPS) and Schlumberger Production Management (SPM). The Cameron Group consists of the principal technologies involved in pressure and flow control for drilling and intervention rigs, oil and gas wells and production facilities. SLB has a current market cap of $24.6 billion.
Earnings and Sales Growth: Over the last twelve months, earnings decreased -16.6%, while sales declined -5.4%. In the last quarter, earnings dropped by almost -36% while sales declined by -9.4%. SLB’s operating profile is an alarming reflection of the pandemic; Net Income versus Revenue over the last year was -55.19%, deteriorating even more in the last quarter to about -99%.
Free Cash Flow: Despite the negative Net Income pattern, SLB’s Free Cash Flow is healthy, at a little more than $4.46 billion. It is also interesting Free Cash Flow was about $3.7 billion at the end of 2019. The current number translates to a Free Cash Flow Yield of 18.1%.
Debt to Equity: SLB has a debt/equity ratio of .96, which is generally conservative , but increased from the quarter prior when it was .61; it is also worth nothing that in June of 2019, Debt/Equity was around .46. Cash and liquid assets in the last quarter were $3.34 billion (an increase of about $1 billion in the last year) versus $15.4 billion in long-term debt. Since the company’s operating profile is negative, SLB will have to use available cash to service its debt. This is an element that bears watching in the quarters ahead; if the company can reverse its Net Income story, it can direct cash to other, more productive activities than simply servicing debt.
Dividend: SLB pays an annual dividend of $.50 per share (reduced from about $2.00 per share a year ago, no surprise given the erosion of the company’s profitability), which at its current price translates to a dividend yield of about 2.88%.
Price/Book Ratio: there are a lot of ways to measure how much a stock should be worth; but I like to worth with a combination of Price/Book and Price/Cash Flow analysis. Together, these measurements provide a long-term target at almost $26 per share. That means the stock is trading at a tempting discount, with about 51% upside from the stock’s current price.
Technical Profile
Here’s a look at the stock’s latest technical chart.
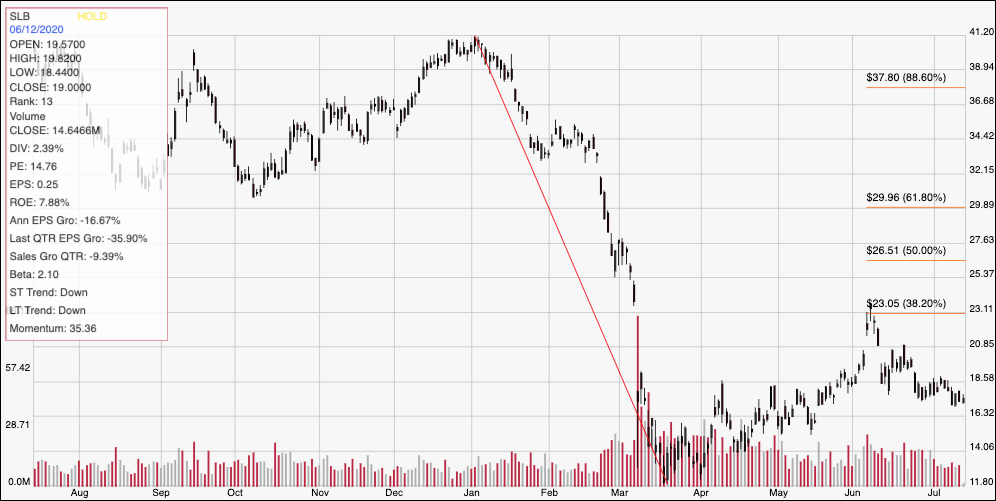
Current Price Action/Trends and Pivots: The chart above displays the last year of price activity, with the diagonal red line tracing the stock’s plunge from about $41 in January to a pandemic-induced low at around $12 in March. It also provides the baseline for the Fibonacci retracement lines shown on the right side of the chart. After pushing all the way to the 38.2% retracement line at around $23 in June, the stock has fallen back and begun to consolidate in a narrow trading range, with support around $16.50 per share and resistance at about $18.50. That means that a push above $18.50 should give the stock room to push back to test the 38.2% retracement line resistance at around $23, while a drop below $16.50 could see the stock fall to next support at around $14, with room to test the bear market low at $12 if bearish momentum continues.
Near-term Keys: There really isn’t any way to suggest that SLB’s value proposition right now is anything but a value trap; only an extremely aggressive and speculative investor would be willing to buy the stock with any kind of long-term forecast right now given the current difficulties in the company’s operating profile. That means that the best probabilities lie with short-term trading strategies; if the stock drops below $16.50, consider shorting the stock or buying put options, using $14 as a quick-hit profit target. A rally and break above $18.50 would offer an interesting signal to buy the stock or work with call options, using a range anywhere between $21 and $23 as a useful profit target on a bullish trade.