Throughout most of this year, semiconductors have been perhaps the most distressed sector of the market. Before bottoming at the end of the October, the sector had dropped a little over 21% from its high point in mid-March as measured by the iShares Semiconductor ETF (SOXX), and is still down nearly 15% as of Thursday’s close. This is a sector that is dominated by large-cap, well-known names like Intel (INTC), Texas Instruments (TXN), and Qualcomm (QCOM), to name just a few.
After this week’s mid-term elections, a divided government, with Democrats now in the majority in the House of Representatives while Republicans retained control of the Senate is likely to blunt the ability of the Trump administration to maintain the aggressive, combative and confrontational nature of its agenda. The market in particular seems hopeful this new political reality can provide a natural check and balance that will return market conditions to some semblance of normalcy. If is correct, that could even extend into trade and tariffs, which have been a primary sentiment drivers against the semiconductor sector, since so much of that business consists of imports from China. Will Trump be more motivated to get a deal done sooner? We’ll see; in the meantime, I believe we could see a short-term, sentiment-based rally in the sector that could provide some nice opportunities in a lot of stocks with very impressive fundamentals.
One of the stocks that has held my attention for a few years now is Applied Materials (AMAT), a company that occupies what I think is a superior niche in the sector as the provider of semiconductor manufacturing and fabrication equipment throughout its industry. This company’s customer include every major chip producer in the market, with operations that extend across the globe. The stock is one of the worst performers in an underperforming sector since March, having dropped more than 50% from its high point, but like the rest of the sector may have also found a bottom, rallying from about $31 at the end of October to its current price around $35 per share.
Is the stock a good buy now? Perhaps; in July, with the stock hovering in the mid-$40 range, I forecast a trend bottom at around $28 per share – not far from the $31 low the stock pivoted higher from just about a week ago. The company’s fundamental profile remains very strong, and if sentiment for the sector continues to shift bullishly, AMAT is a stock that should benefit strongly from a broader push higher. Given the size of the stock’s drop to this point, the technical upside looks compelling; the value-based proposition remains a bit mixed, however and really depends on what metric you decide to work from.
Fundamental and Value Profile
Applied Materials, Inc. provides manufacturing equipment, services and software to the global semiconductor, display and related industries. The Company’s segments are Semiconductor Systems, which includes semiconductor capital equipment for etch, rapid thermal processing, deposition, chemical mechanical planarization, metrology and inspection, wafer packaging, and ion implantation; Applied Global Services, which provides integrated solutions to optimize equipment and fab performance and productivity; Display and Adjacent Markets, which includes products for manufacturing liquid crystal displays, organic light-emitting diodes, upgrades and roll-to-roll Web coating systems and other display technologies for televisions, personal computers, smart phones and other consumer-oriented devices, and Corporate and Other segment, which includes revenues from products, as well as costs of products sold for fabricating solar photovoltaic cells and modules, and certain operating expenses. AMAT has a current market cap of $34.3 billion.
Earnings and Sales Growth: Over the last twelve months, earnings increased 39.5%, while sales increased almost 19%. Growing earnings faster than sales is difficult to do, and generally isn’t sustainable in the long-term; however it is also a good indication of a management’s ability to maximize their business operations. The company’s Net Income versus Revenue was more than 26% in the last quarter, which indicates their operating margins are very healthy. That also represents a significant improvement over the last twelve months, where Net Income was a little less than 20%. The fact the company’s margin profile improved in the last quarter is an interesting counterpoint to the idea that tariff and trade tensions are working against the stock, which draws a major portion of its revenues from China
Free Cash Flow: AMAT’s Free Cash Flow is strong, at more than $2.5 billion. While this number declined from about $4 billion a couple of quarters ago, it has increased consistently since late 2015 when it was a little under $1 billion
Debt to Equity: AMAT has a debt/equity ratio of .78, which is manageable despite its increase from .62 since the first quarter of the year. The company has nearly $4 billion in cash and liquid assets, which means they they have plenty of liquidity, against $5.3 billion in total long-term debt
Dividend: AMAT pays an annual dividend of $.80 per share, which at its current price translates to a dividend yield of about 2.3%
Price/Book Ratio: there are a lot of ways to measure how much a stock should be worth; but one of the simplest methods that I like uses the stock’s Book Value, which for AMAT is $6.94 per share. At the stock’s current price, that translates to a Price/Book Ratio of 5.03. The stock’s historical average is 4.06. That is a pretty good indication the stock could still be overvalued right now despite its decline since March. A move to par with its historical average would put the stock a little above $28 per share. By contrast, the stock is also trading almost 75% below its historical Price/Cash Flow levels, which translates to a long-term target price in the $60 range. How do you resolve the difference? One way to think about it is in terms of reward: risk. If the Price/Cash Flow forecast is correct, the stock has more than $27 of upside, while if the Price/Book is more accurate, the downside is about $7 right now. That’s a reward: risk ratio of nearly 4:1 – something that most traders will tell you is very interesting.
Technical Profile
Here’s a look at the stock’s latest technical chart.

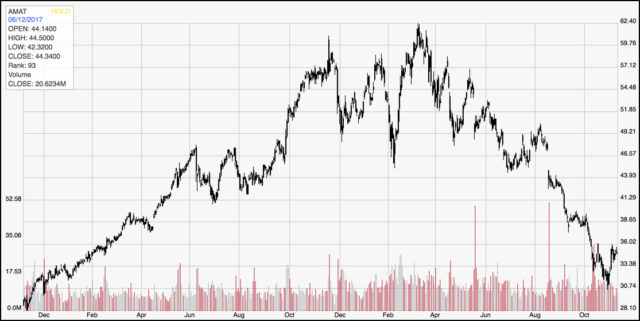
Current Price Action/Trends and Pivots: The chart above covers the last two years because I want to give you an idea of how far AMAT has come; the impressive rise from around $15 that started at the beginning of 2016 to a high above $60 is remarkable by any measure. The stock’s terrific run was driven in no small part by the company’s fundamental strength, and those fundamentals remain solid, so there is an argument to be made that the stock should remain higher than it where it started. The stock’s pivot low around $31 is a very short-term technical bounce, to be sure, and that certainly doesn’t guarantee the downward trend that began in March is over; but if there is a legitimate shift in investor and institutional sentiment in favor of semiconductor stocks that is about to happen, this could mark the beginning of a new bullish trend reversal. The closest, and most likely resistance level appears to be at around $39 per share, with solid support in the $31 area.
Near-term Keys: If you like working the short side of the market, the strength of the downward trend might make a bearish trade look tempting right now; but the truth is that shorting the stock or buying put options right now is a very low-probability trade. That could change if the stocks breaks down and drops to about $30 per share. Otherwise, a bullish trade looks like the way to go; if you want to work with a short-term, momentum-based trade, wait for the stock to break above $36 per share before you buy the stock or start working with call options. If the size of the stock’s decline since March looks interesting, and you like the value proposition offered its historical Price/Book metric, this could also be an excellent level to start thinking about taking a new position with a long-term view.