Fibonacci technical analysis is the popular study of identifying potential high probability support and resistance levels in the future, based on past price trends and reversals. The most common Fibonacci tools that are used by traders on the charts of the financial markets are known as:
Fibonacci Internal Retracements
Fibonacci analysis is based on the mathematical discoveries of Leonardo Pisano also known as Fibonacci, he was known in his time and is still recognized today as the “greatest European mathematician of the middle ages. He is credited with discovering a sequence of numbers that now bears his name the Fibonacci sequence. This is despite the sequence being described much earlier in ancient Indian mathematics.
Introduced to the West in his book Liber Abaci in 1202 the Fibonacci sequence is a series of numbers that progresses as follows,
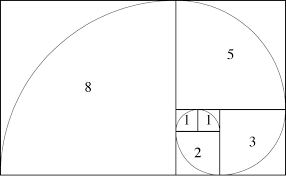
0, 1, 1, 2, 3, 5, 8, 13, 21, 34, 55,89
To arrive at each subsequent number in the sequence, you simply add the two preceding numbers in the sequence. For example, to find the number that follows 89 in the sequence, you add 55 + 89 (the two preceding numbers in the sequence).
The sum of 55 + 89 is 144. This is the next number in the sequence and so on.
0,1,1,2,3,5,8,13,21,34,55,89,144,233,377,610…..
What Fascinated Fibonacci about this sequence was not just the numbers themselves, but rather the relationships among the numbers, or the ratios created by various numbers in the sequence. The most
important ratio is 1.618—also known as the golden ratio, or golden mean. This number can be found throughout nature, the universe and also the ancient world and throughout the Fibonacci sequence.
Each number in the Fibonacci sequence is 1.618 times larger than the preceding number.
For example, 144 is 1.618 times larger than 89 (144 ÷ 89 = 1.618).
There are many other ratios that can be derived from the Fibonacci sequence, these ratios are applied to the charts of financial markets by traders to help identify potential support and resistance areas. Most software charting packages will have Fibonacci drawing tools which will apply the ratios to a market with a few clicks of a mouse
In the world of technical analysis, the most common and widely used Fibonacci ratios to analyze financial charts are:
Common Fibonacci Ratios
Retracements
0.236
0.382
0.500
0.618
0.786
0.886
How are ratios derived from the Fibonacci sequence?
The ratios derived from the Fibonacci sequence in many cases can be calculated in more than one way.
I have given you a few examples on how to arrive at some of the ratios, and I will leave it up to you to discover how to calculate the others. I have found that having a good understanding of how each ratio is derived and discovering ratios that are uncommon and not well known to the masses, can greatly improve your trading and give you an edge over other market participants.
This is because, many of these unknown ratios, act just as strongly as support and resistance to price action in all markets and all time frames, as the more well-known ratios.
The Ratios
The 23.6% ratio is found by dividing one number in the series by the number that is three places to the right. For example: 8/34 = 0.2352.
The 38.2% ratio is found by dividing one number in the series by the number that is found two places to the right. For example: 55/144 = 0.3819.
The 0.618 ratio is found by dividing one number in the series by the number found one place to the right. for example: 89/144 = 0.618
The 1.618 ratio is found by dividing the one number in the series by the number one place to the left. for example 34/21 = 55/34 = 01.618