As the market dropped from historical highs, nearly to bear market territory in the last quarter of the year, the Consumer Staples sector was one of the hardest hit. That seemed a little ironic, since much of the broad decline was driven by uncertainty and fear about the health of the global economy, and the chances it could ripple over into the U.S. economy; trade tensions between the U.S. and China stoked that concern even more. That kind of uncertainty often leads investors to look for defensive-oriented investments with less exposure to the cyclicality of the economy, and Consumer Staples can often be an interesting place to find them.
The good news is that since the beginning of the new year, consumer staples stocks have rebounded with the rest of the market. The question is has that rebound created broad sector-based momentum that could set up good opportunity for the entire sector? You really have to evaluate each stock on an individualized basis to answer that question. One interesting stock in the sector is a company that you may not recognize by name, but whose products you undoubtedly consume. Sysco Corp. (SYY) is a company in the food industry. Where most of us, however might think of grocery stores or restaurants when we think of that industry, SYY is one of the largest food distributors in the nation to many of those companies.
SYY’s price performance at the end of 2018 nearly mirrored that of the broad market’s; after peaking in mid-August at around $76 per share, the stock dropped to around $60, marking a decline into bear market territory. And while the broad market has increased about 6% from its late 2018 low, SYY’s performance so far this year has underperformed, increasing about 3%. Despite its underwhelming price activity, the stock does appear to be forming a short-term upward trend, and so the question remains whether there is a good opportunity to be had for this stock that you should pay attention to. Let’s run the numbers and let you decide.
Fundamental and Value Profile
Sysco Corporation (Sysco) is a distributor of food and related products primarily to the foodservice or food-away-from-home industry. The Company’s segments include Broadline, SYGMA and Other. The Broadline segment includes its Broadline operations located in the Bahamas, Canada, Costa Rica, Ireland, Mexico and the United States. Broadline operating companies distribute a full line of food products and a range of non-food products to both traditional and chain restaurant customers, hospitals, schools, hotels, industrial caterers and other venues where foodservice products are served. SYGMA operating companies distribute a full line of food products and a range of non-food products to certain chain restaurant customer locations. The Other segment includes the Company’s specialty produce; custom-cut meat operations; lodging industry segments; a company that distributes specialty imported products; a company that distributes to international customers, and Sysco Ventures platform. SYY has a current market cap of about $33 billion.
Earnings and Sales Growth: Over the last twelve months, earnings grew by nearly 23%, while revenue increased about 4%. In the last quarter, earnings declined by -3.19% while sales were mostly flat, but still negative by -.66%. The company operates with a very narrow, but consistent operating margin; over the last twelve months, Net Income was about 2.52% of Revenues, and 2.83% over the last quarter.
Free Cash Flow: SYY’s free cash flow is healthy at a little over $1.7 billion. That translates to a mostly unimpressive Free Cash Flow Yield of a little over 5%.
Dividend: SYY’s annual divided is $1.56 per share, which translates to a yield of about 2.45% at the stock’s current price.
Price/Book Ratio: there are a lot of ways to measure how much a stock should be worth; but one of the simplest methods that I like uses the stock’s Book Value, which for SYY is $5.08 and translates to a Price/Book ratio of 12.51 at the stock’s current price. That is a very high multiple by itself, however I also apply that ratio to its historical average to provide a reasonable context for the way the market treats different stocks. In this case, the stock’s historical average Price/Book ratio is 12.13, meaning that the stock is slightly overvalued, but about -3%.
Technical Profile
Here’s a look at the stock’s latest technical chart.
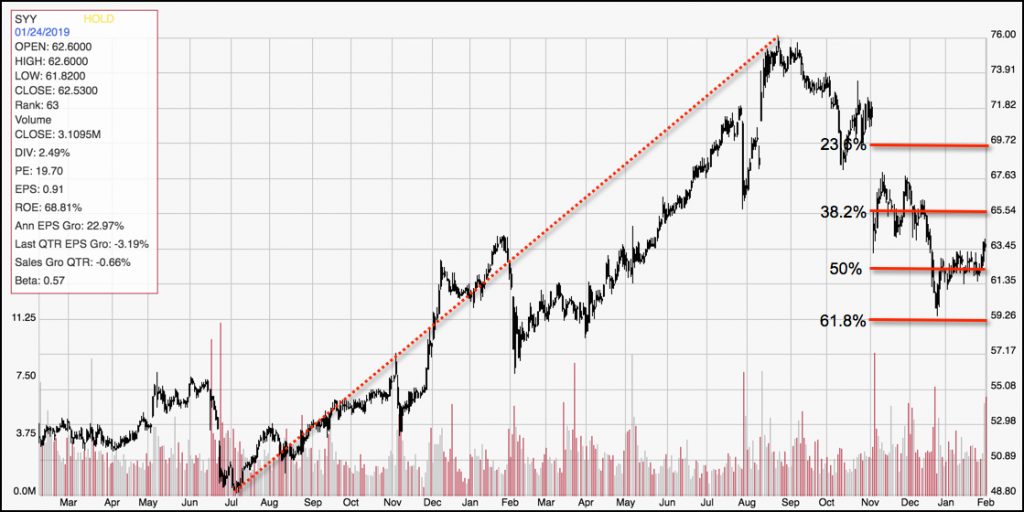
Current Price Action/Trends and Pivots: The diagonal, dotted red line traces the stock’s upward trend from July 2017 to August of last year. It also provides the baseline for the Fibonacci retracement lines shown on the right side of the chart. From that August high, the stock declined all the way to rebound off of the 61.8% Fibonacci line and push above the 50% line. The stock is about $2 away from resistance at the 38.2% line, and about $1 above support as represented by the 50% line. The stock’s pattern since late December marks a short-term upward trend.
Near-term Keys: The stock’s upward trend is such that it could offer an interesting bullish trading opportunity; however the best signal would come from a break above $65.50. From that point, the stock should have room to push near to the next resistance at around $69.50 per share. That could be a nice short-term, momentum-based trading opportunity to buy the stock or to work with call options. If, however the stock breaks down to drop below $62 per share, which is where the 50% line sits, there could be a very interesting chance to short the stock or work with put options. From a value-based standpoint, however the stock doesn’t really represent any kind of significant bargain. The stock would have to drop to around $49 before its price would really offer a really interesting long-term opportunity.