One of my favorite methods for paying attention to the broad market, and to track the ebb and flow of institutional interest is to pay attention to sector rotation. As economic data indicates one sector may be more favorably positioned than another, institutions like mutual funds and investment banks will often shift their assets into the areas they think are most likely to lead the market. Since institutions price movement far more than any other investing group, it makes sense to try to follow their lead. In the same vein, when you see a certain sector moving into favor, one of the simplest ways to try to jump on that particular bandwagon is to look at the largest, most recognizable and best-established names in the sector.
Since the beginning of the year, Industrials have been among the market leaders, with the sector moving up a little over 14% year-to-date as measured by the S&P 500 Industrial Sector SPDR (XLI). Without question, the 600-lb. gorilla in this sector is Caterpillar Inc. (CAT). It would be natural to expect that if the sector has seen such an impressive level of bullish momentum, CAT should be at the forefront. It might surprise you, then to learn that the stock has severely underperformed the rest of the sector, increasing a little less than 4% over the same period.
Of course, if you think about it on annualized basis, 4% in just a little over a month doesn’t sound too bad at all; but the fact that the single biggest player in the Heavy Machinery industry anywhere in the world has seen such a lackluster stock performance begs the question: what gives? I think a big part of the answer comes, at least in part, from the fact of its size and dominant market position. CAT machinery is in service in practically every country throughout the world; this is a U.S. multinational that generates more than 59% of its revenue from outside the United States. As such, the company is considered a bellwether for global economic health. Concerns about a slowing global economy, including indications of continued contraction in China (verified not too long ago by CAT’s own CEO) seem to be putting a lid on the stock’s ability to follow the rest of the sector.
The next question that naturally comes up is whether the stock should be priced higher than it is right now, or is Mr. Market pricing in its concerns about the stock correctly? From the standpoint of the stock’s fundamental profile and value proposition, I don’t think it’s actually being nearly bearish enough. To be clear, the company isn’t in any danger of going out of business; they have a very healthy margin profile, a large amount of available cash, and their dominant market position all playing into their favor. They also have a ton of debt, deteriorating Net Income, and declining profitability, along with expected headwinds tied to tariffs and that global economic slowdown working against them.
Fundamental and Value Profile
Caterpillar Inc. is a manufacturer of construction and mining equipment, diesel and natural gas engines, industrial gas turbines and diesel-electric locomotives. The Company operates through segments, including Construction Industries, which is engaged in supporting customers using machinery in infrastructure, forestry and building construction; Resource Industries, which is engaged in supporting customers using machinery in mining, quarry, waste and material handling applications; Energy & Transportation, which supports customers in oil and gas, power generation, marine, rail and industrial applications, including Cat machines; Financial Products segment, which provides financing and related services, and All Other operating segments, which includes activities, such as product management and development, and manufacturing of filters and fluids, undercarriage, tires and rims, ground engaging tools, fluid transfer products, and sealing and connecting components for Cat products. CAT’s current market cap is $77.9 billion.
Earnings and Sales Growth: In the last twelve months, earnings grew a little more than 18% while revenues increased about 11%. The picture is less attractive in the last quarter, as earnings declined almost 11% amid sales that grew about 6%. The company’s healthy operating margin appears to be shrinking, which is a concern. In the last twelve months, Net Income was 11.2%, but in the last quarter was only 7.3%.
Free Cash Flow: CAT’s free cash flow is healthy at about $4.57 billion for the last twelve months as of the second quarter of the year. That translates to a modest Free Cash Flow Yield of 5.92%.
Debt to Equity: CAT has a debt/equity ratio of 1.78. This is a high number that has increased over the last two quarters. Their balance sheet indicates they hold about $8 billion in cash and liquid assets against more than $25 billion in long-term debt. Their operating profits, for the time being are adequate to service their debt; however the large difference between these numbers, along with the company’s deteriorating Net Income means that their liquidity is a concern.
Dividend: CAT pays an annual dividend of $3.44 per share, which translates to a yield of about 2.83% at the stock’s current price.
Price/Book Ratio: there are a lot of ways to measure how much a stock should be worth; but one of the simplest methods that I like uses the stock’s Book Value, which for CAT is $23.86 per share. That number is another red flag for me, since it declined in the last quarter from nearly $27 per share. It also translates to a Price/Book ratio of 5.53 at the stock’s current price. The stock’s historical Price/Book ratio, however is only 3.92, suggesting the stock is about -29% overvalued right now. That puts the stock’s “fair price” at around $93.50 per share – a level the stock hasn’t seen in the last two years.
Technical Profile
Here’s a look at the stock’s latest technical chart.
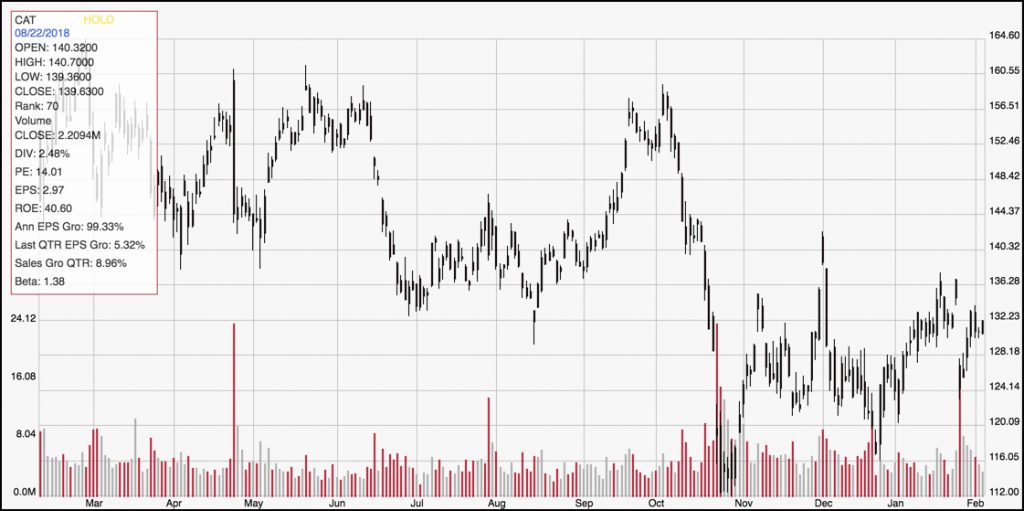
Current Price Action/Trends and Pivots: The chart above outlines the stock’s movement over the past year. The stock established a pretty interesting consolidation base from November to the end of 2018 between $124 on the low end and $136 on the high end, and is currently hovering on the upper end of that range. If the stock can manage to break above that range, it would mark a new upward trend for the stock, with room to push above $144 and possibly even test the stock’s 52-week highs around $156 per share.
Near-term Keys: A break above $136 could present an interesting short-term bullish trading opportunity using call options or buying the stock; however if the stock pivots off of that resistance and starts to move lower, you could consider shorting the stock or working with put options with a target price between $116 and $112 per share. The stock won’t offer an attractive value-based opportunity until and unless it drops to around $75 per share – a price level the stock hasn’t seen since mid-2016.